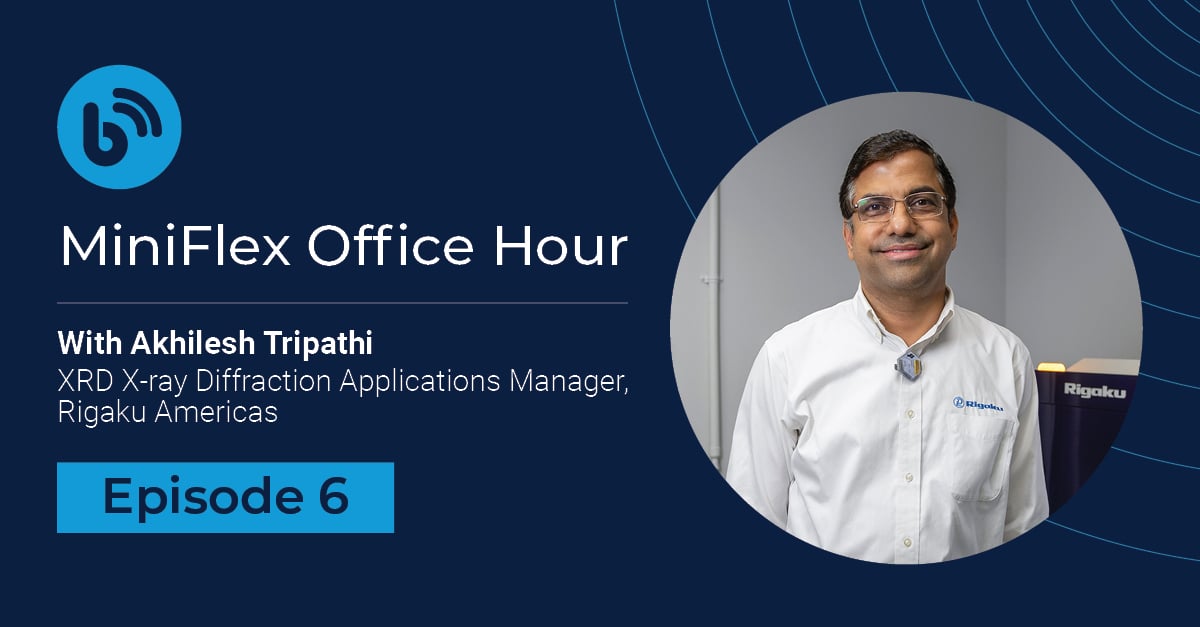
MiniFlex Office Hour Episode # 6 Recap
Aug 29, 2025

Recap provided by Aya Takase
Thank you to everyone who joined us for Episode 6 of MiniFlex Office Hour! As always, our XRD expert, Akhilesh Tripath, shared valuable insights and answered practical questions from MiniFlex users around the world. Below is a quick recap of the key topics we covered.
You can watch the full recording here. If you’re new to MiniFlex, it’s a benchtop X-ray diffractometer that researchers have trusted since 1973.
Episode recap
-
Akhilesh is mostly familiar with the conferences and training courses in North America. Here are his recommendations:
- ICDD (International Center for Diffraction Data) in Newtown, Pennsylvania: ICDD conducts a yearly school that offers detailed theory and hands-on experience with X-ray diffraction, focusing on powder diffraction and quantitative analysis. The MiniFlex is one of the diffractometers used for this training course. The school typically takes place in June and can be a one or two-week program, with the second week often dedicated to quantitative programs. Visit the ICDD Education page for more details: https://www.icdd.com/icdd-education/
- Denver X-ray Conference (DXC): This conference is noted for its excellent paper presentations and sessions, discussing the latest advancements in and new applications of XRD and X-ray fluorescence spectroscopy. Akhilesh and Aya have attended for years. It usually occurs at the end of July or in August. Visit the DXC 2026 event page for more details: https://www.dxcicdd.com/
- GSA (Geological Society of America) short course: On Saturday, October 18, a short course associated with the GSA conference will be conducted by Akhilesh and his team in San Antonio, TX, USA. Visit the GSA site for more details: https://store.geosociety.org/products/sc25cn514
-
Peak broadening is a result of multiple factors that are convoluted. Akhilesh reviewed four major factors to consider:
Sample contribution to peak broadening
-
The sample itself directly affects the peak broadening, often expressed as the full width at half maximum (FWHM), of diffraction peaks.
-
The poor crystal quality, such as microstrains and small crystallite size (< 100 nm), is the main factor broadening peaks:
-
Highly crystalline standard reference materials (SRMs), such as LaB₆, silicon, or corundum, produce very sharp, narrow peaks.
-
Semi-crystalline materials or nanocrystalline powders show broader peaks due to reduced crystallite size and lattice imperfections.
-
Ultimately, amorphous materials produce the broadest features, often appearing as a diffuse "hump" rather than peaks.
-
-
These peak broadenings reflect the intrinsic properties of the sample, such as crystallite size, defects, and strain, and they can be used to analyze these properties.
Instrument contribution (beam divergence and slit settings)
- The instrument has its intrinsic peak broadening.
- Many laboratory powder diffractometers use Bragg–Brentano geometry, where a divergent beam from the source is diffracted by the sample and then focused onto the detector.
-
With Bragg-Brentano geometry, various slits control beam divergence and sample illumination:
-
Divergence slit (DS): The first slit encountered by the X-ray beam. Smaller DS (e.g., 0.625° vs. 1.25° on a MiniFlex) reduces divergence, narrowing peaks but lowering intensity.
-
Height-limiting slit: Restricts beam height on the sample in the vertical direction. It reduces the beam divergence in the axial direction parallel to the sample surface.
-
Soller slits: Parallel metal plates that control axial divergence. Using narrower Soller slits (e.g., 2.5° vs. 5°) reduces asymmetry and long tails on the low-angle side of peaks, reducing peak broadening and improving resolution.
-
-
Tighter control of beam divergence and footprint generally improves resolution, meaning reducing peak broadening, but reduces intensity, often requiring longer counting times.
-
On the diffracted side, with modern high-speed detectors, it is common to keep slits more open to maximize throughput. Older systems might use a 0D detector (scintillation counter). In this case, you need a receiving slit to secure resolution.
Distinguishing sample from instrument effects
-
To separate instrument broadening from sample broadening, it is essential to measure a standard material with negligible size/strain broadening.
-
Common standards include silicon, alumina (Al₂O₃/corundum), and LaB₆. Among these, LaB₆ typically gives the sharpest peaks and is widely used.
-
Once the instrument contribution is determined, modern software can deconvolute it from experimental data, ensuring accurate comparison across different instruments and conditions.
-
This calibration only needs to be performed once per instrument geometry unless optical components are changed.
Absorption and transparency effects
-
In Bragg–Brentano geometry, the X-ray beam penetrates below the sample surface. Depending on absorption properties, this can introduce peak broadening and shifting ("transparency effect").
-
When the sample is highly transparent to X-rays, the difference in the transparency effect between the sample and the standard needs to be considered.
-
Samples containing mainly light elements (C, H, N, O), such as organics, often exhibit more significant peak broadening caused by the transparency effects.
-
To minimize this particular type of broadening and match it to that of the standard material, use a zero-background holder and prepare the sample as a thin layer. This technique is useful for any transparent (light-absorbing) materials, such as metal-organic frameworks (MOF).
-
-
In-situ/time-resolved experiments mean that you monitor how a material’s crystal structure evolves as a function of time, temperature, or other external conditions. On a MiniFlex, common examples include:
- Battery cell attachment: Tracking diffraction patterns during charge–discharge cycles.
- Heating stages: Observing structural changes as a material is heated, such as transitions to new crystal phases, dehydration, or oxidation.
Careful planning pays off when you conduct in-situ experiments because you often run tens and hundreds of scans, and the entire cycle can take a long time. You don't want to realize that your settings were not the best to capture the phase transitions after spending hours and collecting hundreds of scans.
Best practices for planning
-
Preliminary ex-situ experiments: Perform quick ex-situ trial runs using a simple at room temperature and after it is heated and changed its form. For example, heat a sample to 100°C ex-situ, then collect a pattern to see whether phase changes occur. This establishes the temperature range of interest. Extend the upper temperature range beyond the expected transition point to ensure the full transformation is captured. If the sample quantity is limited, review the literature to anticipate phase transition temperatures.
-
Determine optimal settings: Because many scans will be collected, optimize speed vs. resolution based on the trial scans. Set the scan range to sufficiently cover the range where characteristic diffraction peaks show. To keep the experiment time within a manageable range, avoid running unnecessarily wide scans. You can also limit the 2θ range to where changes are expected if you already know the phases and identification is not necessary.
-
Double-check the instrument condition: For overnight or long heating runs, verify stable water-cooling connections for heating stages. Double-check hoses and flow systems to avoid leaks or interruptions during unattended operation.
-
Here is the quick overview of data analysis from start to finish:
- Load data to analysis software:
- Once data is collected, use a program like SmartLab Studio II (SLS II). If you are using SLS II, go to the "Powder" tab for powder pattern analysis.
- Initial data interpretation:
- The software automatically applies a good background function and identifies peaks.
- If the software misses a small peak of interest, though it is rare, there's an "Add" button to manually include it. Modern software largely automates initial steps like background fitting, Kα₂ removal, and peak searching.
- Search match:
- The software automatically provides the best-matching phases for phase identification.
- You can supplement the search with elemental information if known (e.g., common geological elements like sodium, calcium, magnesium, potassium, aluminum, silicon, oxygen, titanium or elemental analysis results).
- You should visually verify the matches and apply your knowledge about the sample, intuition, and common sense to confirm the identification. It is important not to blindly trust the software recommendation.
- After confirming, click the "set" button to accept the identified phases to move onto further analyses.
- Quantitative analysis:
- Once phases are identified, you can perform quantitative analysis by using RIR (Reference Intensity Ratio) to get a rough estimate of the quantity of each phase, or Rietveld Analysis for more detailed and precise analyses.
- Load data to analysis software:


Subscribe to the Bridge newsletter
Stay up to date with materials analysis news and upcoming conferences, webinars and podcasts, as well as learning new analytical techniques and applications.

Contact Us
Whether you're interested in getting a quote, want a demo, need technical support, or simply have a question, we're here to help.
