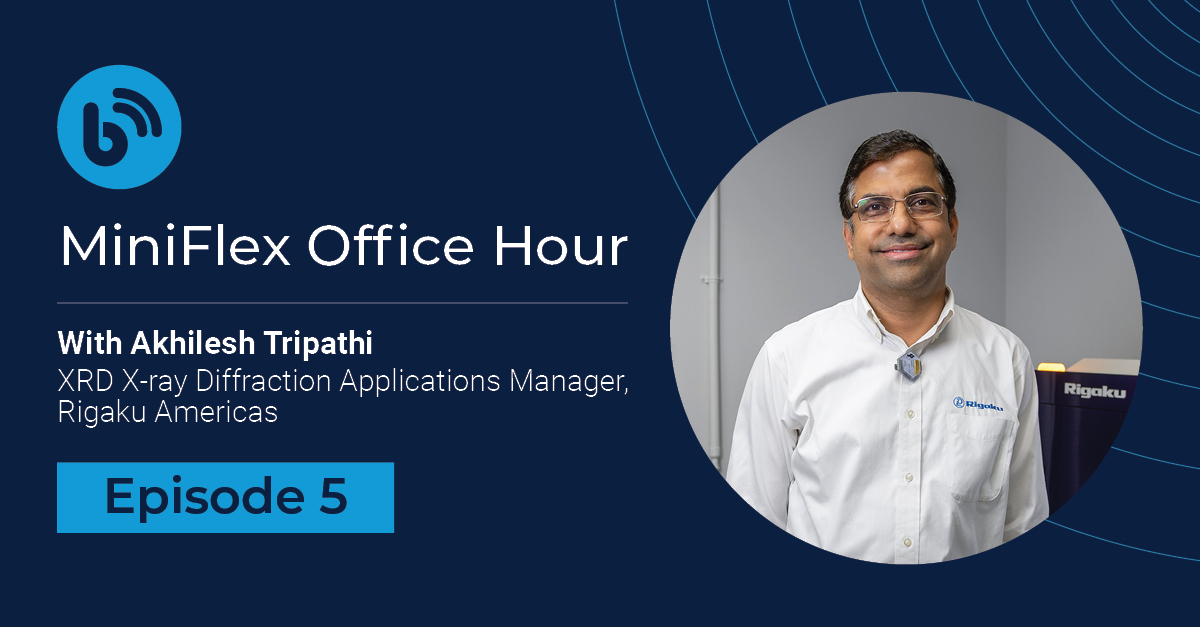
MiniFlex Office Hour Episode # 5 Recap
Jul 21, 2025

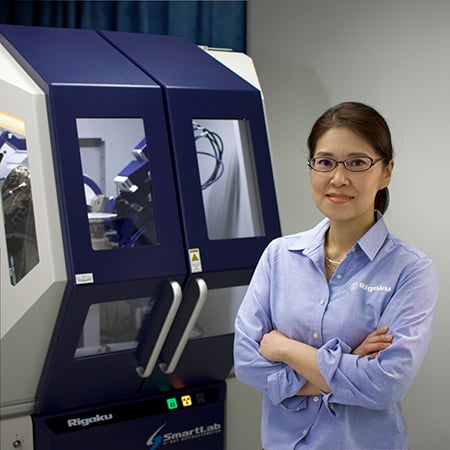
Recap provided by Aya Takase
Thank you to everyone who joined us for Episode 5 of MiniFlex Office Hour! As always, our XRD expert, Akhilesh Tripath, shared valuable insights and answered practical questions from MiniFlex users around the world. Below is a quick recap of the key topics we covered.
You can watch the full recording here. If you’re new to MiniFlex, it’s a benchtop X-ray diffractometer that researchers have trusted since 1973.
Episode recap
-
There isn't one universal set of parameters that works for all samples. However, software like Rigaku SmartLab Studio II or the previous version, PDXL, offers default scan parameters as a starting point. These typically include a range of 3 to 90° with a step size of 0.02° and a speed of 10° per minute.
You can assess if these parameters are suitable by:- Determining if the scan range is wide enough: Determine if most of your sample's peaks fall within the 3-90° range. This range is generally good for most materials, including ceramics, metals, organics, inorganics, and pharmaceutical materials. However, materials with a large unit cell, such as mesoporous materials and clays, can have peaks below 3°; you might want to check.
- Checking if the scan range is too wide: For organics, a range of 3-50 or 55° might be sufficient, as their atomic scattering factors decrease around that point, meaning you don't necessarily need to go up to 90°. Inorganic materials, however, can benefit from a 90° range. Metals with a small unit cell might not have any peaks below 30°. In that case, you can start the scan there. Running a quick initial scan can help determine the appropriate range for your specific set of samples.
- Evaluating signal-to-noise: If the data appears very noisy, you may need to reduce your scan speed. Conversely, if the peaks look very sharp and high intensity, you could go faster, 20° per minute, for example.
-
Noisy data can stem from the nature of the sample itself, particularly if it's not very crystalline (e.g., semi-crystalline or amorphous samples naturally produce low diffraction intensity, thus a high level of noise). To improve the signal-to-noise ratio:
- Repeat the scan multiple times: The MiniFlex software allows you to run the same scan 2, 4, or even 10 times. When analyzing, you can choose to average these scans into one to reduce the noise level. Noise tends to vary randomly, so averaging multiple scans can effectively reduce it.
- Reduce the scan speed: Instead of 10° per minute, you could slow it down to 5° per minute, for example.
- Ensure the sample is well ground: Ideally to 325 mesh or between 40 to 80 microns. While some materials (like Muscovite) can be damaged by excessive grinding, most will not lose their crystal structure at this level of grinding. A well-ground and well-packed sample will generally produce a much better signal-to-noise ratio compared to a sample that is just loaded without proper packing.
-
Yes, adjusting the step size is a very important consideration. The common default step size of 0.02° was chosen because for sharp, highly crystalline materials (like SRM, lanthanum hexaborate, silicon, or corundum), the full width at half maximum (FWHM) of their sharpest peak, when divided by 5 or 7, often results in a number around 0.01 or 0.02°. Using this small step size ensures you don't miss any information for sharp peaks.
However, if your peaks are very broad, such as those from nanomaterials, disordered materials, or materials with very small crystal sizes, dislocations, or amorphous content, using a very small step size (like 0.01 or 0.02°) can increase the noise level unnecessarily. In such cases, taking the average FWHM of the broad peaks and dividing it by 5 or 7 might suggest a larger step size, such as 0.05 or 0.08°. This larger step size can increase the total X-ray count per data point, resulting in a higher signal-to-noise ratio and smoother data.
It's crucial to remember that if you have a mixture of amorphous or poorly scattering material and crystalline material (i.e., both sharp and broad peaks), you must prioritize the sharper peaks and choose a smaller step size. A larger step size is only appropriate if all the peaks in your sample are broad.
-
This is because 12° is the resting position of the instrument's arms. It's similar to how large clocks in a shop are often set to 10 after 10.
-
The MiniFlex has a cool personality. It's very helpful and doesn't create many problems. It's also cost-effective because the only consumable is the X-ray tube, and it doesn't consume a lot of money or external resources like faucets, as it has its own cooling system. Despite being a desktop instrument, it provides high-intensity data comparable to or even better than floor models because the X-ray tube is brought closer to the detectors. It fulfills all powder diffraction needs, and I consider it my "best friend in my job."
-
When dealing with a completely unknown sample, follow these good practices:
- Gather context about the sample: Before you even begin the measurement, ask where the sample came from and who made it. Information such as its origin (e.g., Appalachian Mountain range, Himalaya Mountains), industry (e.g., cement company, synthetic lab), or type (e.g., rock, pharmaceutical) provides crucial clues. This context helps you select appropriate search parameters and databases in the software (e.g., mineral, rock, forensic, organic, pharma).
- Prepare the sample well: Grind the sample thoroughly to a fine powder (around 325 mesh or 80 microns). Most materials will not lose their crystal structure from this level of grinding, and it ensures proper sampling with a randomly distributed, averaged behavior for powder diffraction. Then, pack the sample well into the holder, as a well-packed sample produces a much better peak-to-background ratio.
- Run a broad initial scan: Load the well-prepared sample and run it over a normal, wide range, such as 3 to 90° at a speed of 10 or 15° per minute, so you don't miss anything. This typically takes only 7 or 8 minutes and is an affordable starting point.
- Utilize search-match software: Modern search-match software is very powerful. It performs searches based on the three strongest peaks (their intensity and position) and also on the peak profile (shape). These features, combined with comprehensive databases such as ICDD, ICSD, or COD, typically help identify the major phases in your sample.
- Interpret the initial match: The identified major phase will provide a strong clue about the sample type (e.g., if it matches quartz, it's likely a mineral; if it matches aspirin, it's likely organic). This can help identify the remaining minor phases or categorize the rest of the batch of samples.
- Refine data quality: Once you have an initial idea of the sample, you can then follow strategies to improve signal-to-noise and overall data quality for more detailed analysis.
- Use your common sense: If you received the sample from an organic chemistry lab and see uranium oxide showing up in the search result, that most likely indicates that it is an organic material with a diffraction pattern similar to that of uranium oxide. Always use your common sense rather than blindly believe the search results.
-
This is a challenging but common situation where you need to go beyond just the diffraction pattern:
- Incorporate elemental analysis: If the very similar phases have slightly different elemental compositions (e.g., presence or absence of iron), using elemental analysis techniques like XRF or ICP is crucial. For instance, if you're matching a feldspar (like dolomite) and one potential match contains iron while another doesn't, elemental analysis can confirm the presence of iron, helping you choose the correct phase, especially when atomic substitution leads to minor pattern changes. These instruments provide vital complementary information.
- Apply your knowledge and common sense: Don't blindly accept rare or unlikely phases: Software may suggest matches that are chemically or practically improbable for your sample type (e.g., a uranium phase from a pharmaceutical company, or cadmium, selenium, or lead where they are not expected). You need to use common sense or do a sanity check.
- Check MSDS: Check safety data sheets (MSDS) if available. Always ask for MSDS or information on potential elements, especially hazardous ones, if unexpected phases are suggested.
- Leverage your background knowledge: Use your understanding of geology, chemistry, or the sample's likely origin. If a match is for a phase that is not commonly found in the context of your sample, be cautious. Software often has a "forward arrow" to show more similar phases; choose the one that is "largely common" based on your accumulated knowledge.
- Back up unusual findings: If you are convinced an unusual or strange phase is present, you must verify it with supporting evidence, such as elemental analysis (e.g., using XRF to confirm lead if the software suggests a lead phase).
- Recognize the limitations of the technique: Powder diffraction cannot guarantee the accurate identification of all phases (especially with mixtures of six or more phases) for completely unknown samples with the press of a button. It requires your knowledge and experience. While templates can be used for known expected phases (like in cement analysis), this differs from identifying truly unknown samples.
- Consider the possibility of the phase not included in the database: Especially for lab-synthesized materials, new organic or pharmaceutical compounds might not yet be included in crystallographic databases. In such cases, other techniques, such as NMR or IR, may be necessary.
-
There is no single answer for suggested run time, as it is very dependent on the specific sample and your analytical goal. Here are the general guidelines for quantitative analysis using the MiniFlex:
- Highly crystalline samples: For very high-quality samples, such as standard reference materials, 2 minutes can be sufficient.
- Poorly crystalline samples: If your sample is poorly crystalline, you might need to extend the run time up to 30 minutes, and possibly run at a slower speed like 2 degrees per minute.
- Detector type: If you are using an older type of detectors, such as a scintillation counter, it's generally recommended to run for not less than an hour for good results. However, with modern high-speed detectors, such as D/teX Ultra series, HyPix 400, or XSPA 200, a runtime (scan time) of 15 to 30 minutes typically suffices.
- Most general good quality materials: For a decent balance of quality data suitable for Rietveld refinement, 15 minutes is often a good standard.
- Quantitative analysis goals: If your goal is to quantify trace or minor phases, you will need to improve the signal-to-noise ratio by either running slower scans or repeating scans. If your goal is only to quantify the major phase, you can often achieve results much faster.
- Testing the data quality: To ensure the quality and reproducibility of your quantitative analysis, especially for serious Rietveld refinement, it is good practice to repeat the measurement on two different datasets and compare the results. If the answers are not similar, it suggests that there might be too much noise, and the analysis is not reproducible, indicating a need for longer run times or better sample preparation.


Subscribe to the Bridge newsletter
Stay up to date with materials analysis news and upcoming conferences, webinars and podcasts, as well as learning new analytical techniques and applications.

Contact Us
Whether you're interested in getting a quote, want a demo, need technical support, or simply have a question, we're here to help.
