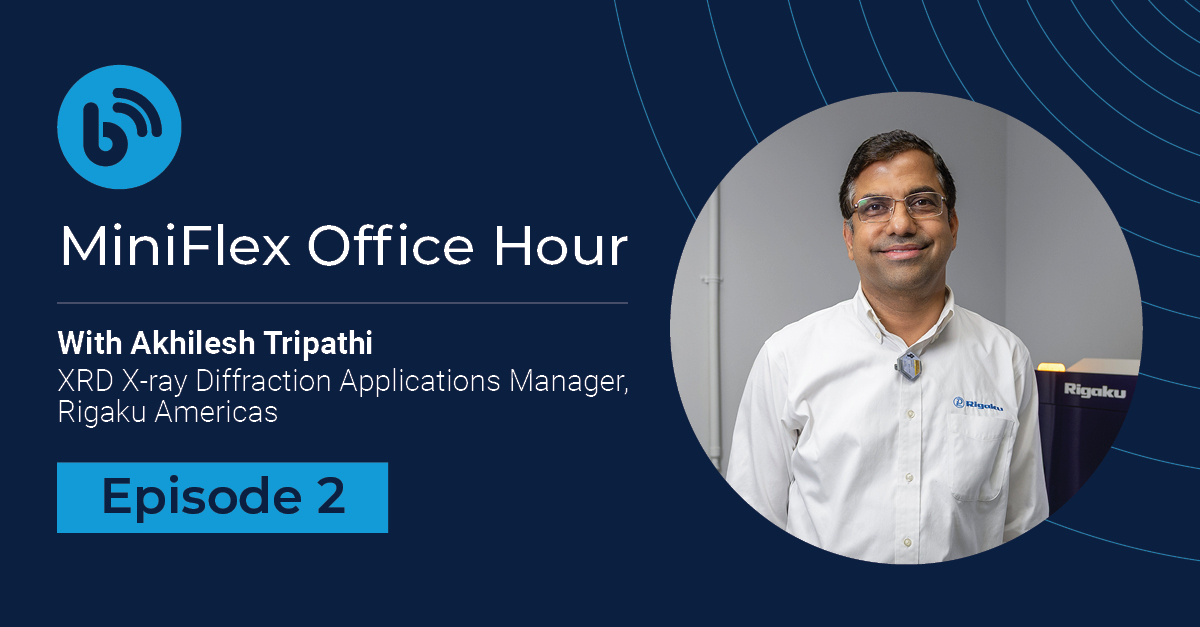
MiniFlex Office Hour Episode # 2 Recap
Jun 3, 2025

Recap provided by Aya Takase
Thank you to everyone who joined us for Episode 2 of MiniFlex Office Hour! As always, our XRD expert, Akhilesh Tripath, shared valuable insights and answered practical questions from MiniFlex users around the world. Below is a quick recap of the key topics we covered.
You can watch the full recording here. If you’re new to MiniFlex, it’s a benchtop X-ray diffractometer that researchers have trusted since 1973.
Episode recap
-
Akhilesh explained that accuracy starts with peak position. The best way to check is by running a standard reference material, like NIST SRM 640g silicon. This material has well-defined unit cell values. If your results match, your instrument is properly aligned.
For peak width calibration, you can use either NIST SRM 640g silicon or SRM 660c LaB₆.
These two SRMs are the best to use to test or calibrate instruments. But they can be pricy. You can also use the less expensive SRM 1976c corundum.
-
You can, but verify it yourself. If you can’t afford a certified standard like SRM 640g, buy an inexpensive silicon powder and check whether the unit cell matches the certified value.
Just be sure to document it properly—only call it certified, SRM, etc., if it is from NIST or a similar organization and you have the certificate.
-
Here is a rule of thumb: If you can see it, you can measure it.
Thanks to high-sensitivity detectors and zero-background sample holders, MiniFlex can analyze sub-milligram quantities—ideal for rare or expensive materials. Just tap a small amount from a brush onto a flush zero-background holder, and you’re good to go.
Heavier elements and crystalline materials will give better X-ray intensity. Lighter elements or poorly crystalline materials might provide lower X-ray intensity. In that case, extend the scan time as needed to collect enough X-ray counts.
-
During Rietveld refinement, each refined parameter comes with a number in parentheses. This is the estimated standard deviation (ESD). It indicates the potential range of the parameter, and a smaller ESD means higher confidence in that value.
For example, 30.3(98) means 30.3 ± 0.98. That’s about 3% uncertainty, which is not great. If you want tighter confidence, improve your data quality by:
- Slowing the scan speed
- Summing multiple scans (SmartLab Studio II lets you average them.)
For quantitative results, ESDs below 1% are ideal. But 2–3% error is generally acceptable in routine XRD.
Rwp (residual weighted profile) and S (goodness of fit) are important Rietveld analysis indicators. They tell you how good and trustworthy the results are. Although there is no widely accepted or officially defined acceptable R value, here is a rule of thumb.
- Rwp < 12% is usually considered good.
- S ≈ 1–3 means your model fits well.
If your Rwp value is high, check:
- Are you using the right phases?
- Is your background function appropriate?
If your S value is high, check:
- Are you overfitting with too many variables?
- Is the 2θ range you are fitting too narrow?
No matter what these values are, always check the fit visually by looking at the difference plot for unfit or missing peaks or any systematic discrepancies between the experimental and calculated profiles.
-
Clays are tricky because they swell with treatment (e.g., heat, ethylene glycol). That’s why many clay researchers use microscope slides. These allow you to drop the sample and evenly spread it using a glass rod.
Slides work well for identifying layered clays like smectite and illite. Clay minerals tend to have lots of peak overlap but, thanks to Rietveld refinement, it’s now easier to separate overlapping peaks and detect minor clay phases.
-
If your sample is packed flat and firm, either geometry works. But for liquid or loose powder, θ–θ is safer since the sample stays horizontal.
To test your prep, tilt the sample holder 45° both ways. If it doesn’t spill, it’s safe to scan on either geometry.
Join us next time
We’ll be back every month with more questions, tips, and insights from Akhilesh. If you use MiniFlex or are curious about benchtop XRD, we hope you’ll join us live next time!
The live event information is posted on our LinkedIn event page.
Got questions in the meantime? Drop your question in the comment section of the most recent episode. Akhilesh will answer them, or we might answer it live during the next office hour.


Subscribe to the Bridge newsletter
Stay up to date with materials analysis news and upcoming conferences, webinars and podcasts, as well as learning new analytical techniques and applications.

Contact Us
Whether you're interested in getting a quote, want a demo, need technical support, or simply have a question, we're here to help.
