Background
In recent years, air purification and water decomposition using photocatalysts has become an active area of research and, in particular, oxide semiconductors are promising materials for photocatalysts because they hardly change even when used under severe atmospheric conditions. Zinc oxide, ZnO, is currently attracting attention as an environment-conscious material with photocatalytic activity. Its direct band gap energy at room temperature is 3.37 eV . The reason for its behavior is thought to be related to its characteristic surface structure and the crystallite size. Using data obtained from X-ray diffraction measurements, the crystallite size distribution can be easily analyzed.
Investigation
In this example, ZnO crystals are heated for one hour in oxygen gas at 400°C, 500°C, 600°C and 700°C. The Cu Kα lines of the heated ZnO crystals are measured using the focusing beam X-ray optical system on Rigaku's SmartLab multipurpose diffractometer to obtain diffraction profiles that can be analyzed to obtain the crystallite size distribution. The 110 diffraction line has a suitable intensity for analysis and does not overlap with any other reflections. Figure 1 shows the measured diffraction profiles and the simulation profiles for this reflection. The diffraction line width becomes narrower as the processing temperature increases, revealing that the crystallite size becomes larger qualitatively.

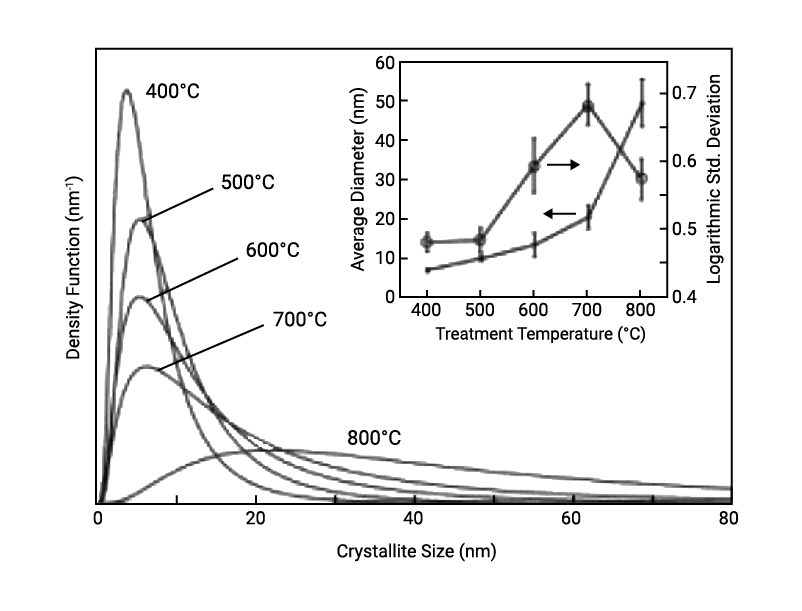
Figure 2 shows the results of the crystallite size distribution analysis. The upper and lower figures show the crystallite number distribution and the crystallite volume distribution, representing the number of the crystallites for a diameter of crystallite and the ratio of the volume of the crystallites, respectively. It becomes clear that for both crystallite number distribution and crystallite volume distribution, the crystallite size becomes larger and the distribution becomes broader as the processing temperature increases.

Samples are provided by Professor Haga, Electronic Engineering Department, Sendai National College of Technology and assistant professor Shishido, Institute of Materials Research, Tohoku University.
References:
[1] Konaka et al., Proceedings of the 5th annual Meeting of Society of Nano Science and Technology P.162/PS74 (2007) [2] Konaka et al., J. Flux Growth, vol.2, (2007) 41