Background
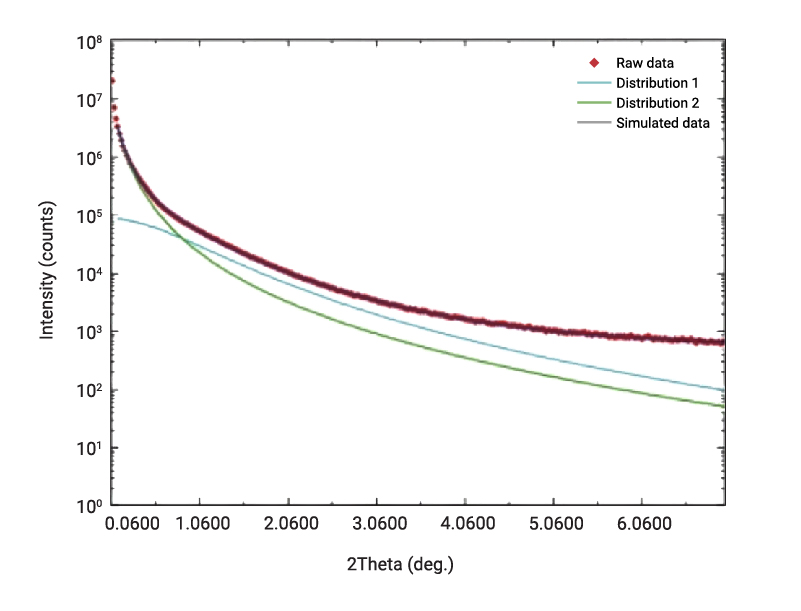
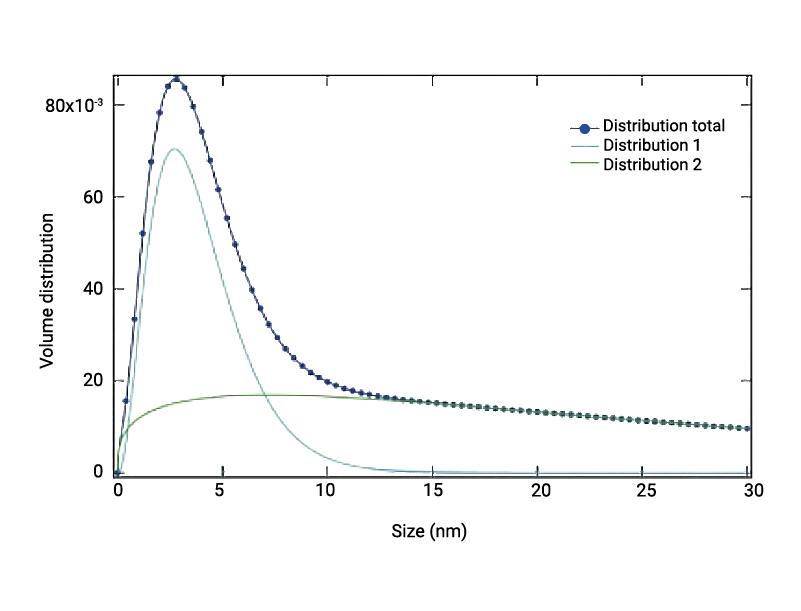
Ceria (CeO₂) is often used as a catalyst or catalyst support. Its applications include photosensitive glass, walls of self-cleaning ovens and low NOx and CO emission automobile engines. The performance of catalysts is often related to the size of the catalyst particles and it is important to measure and control their size distribution. X-ray techniques are often used to estimate the size of nanoparticles in the range of 1 – 100 nm. Two techniques can be used to estimate the size of nanoparticles: Small Angle X-ray Scattering (SAXS) and X-ray Diffraction (XRD). Both techniques provide the estimated size but use different types of scattering and additional information about the nanoparticles can be extracted by comparing the results from those two techniques. Figure 1 shows XRD profile fitting analysis results of CeO₂ nanoparticles. Figure 2 shows SAXS profile fitting analysis results of the same sample. The versatile SmartLab X-ray diffractometer, was used for both techniques. Crystallite size distribution analysis software, PDXL, and SAXS analysis software, NANO-Solver, were used for XRD and SAXS analyses, respectively.

|

|
|
|
The comparison between XRD and SAXS is summarized in the table shown below. Both methods indicated that the nanoparticle and nano-crystallite sizes are not uniform and there is a wide distribution of the size. The SAXS method gave approximately two times larger size than the XRD. This indicates that one nanoparticle consists of multiple crystallites.
|
|
|
|
|
|
|
|
|
|
|
|
Since those two techniques used here provide different views of the nano-sized crystallite particles, more detailed information than simple average size can be obtained by combining them. Both XRD and SAXS techniques are available on the SmartLab and analyses can be done easily using PDXL and NANO-Solver.