Application Note WDXRF1114
Introduction
Cement is one of the most important materials for construction. Many kinds of hydraulic cements, including Portland cement, with various physical properties are produced by changing the composition of clinker minerals; therefore, it is important to control the chemical composition of cement products and interim products.
ASTM C114-18(1) covers chemical analysis of hydraulic cement. In this standard, mainly wet chemical analysis procedures are described and X-ray fluorescence (XRF) spectrometry is mentioned as an example of “Rapid Test Methods.” In practice, XRF spectrometry has been used for chemical composition analysis of cement owing to its simple sample preparation and high precision.
This application note demonstrates quantitative analysis for Portland cement by the pressed powder method according to ASTM C114-18 on Rigaku Supermini200, a benchtop sequential wavelength dispersive XRF spectrometer.
ASTM C114-18 and calibration standard
This is how standard ASTM C114-18 describes “Rapid Test Method”:
· Using the test method chosen, make single determinations for each analyte under consideration on at least seven CRM (Certified Reference Material) samples. Complete two rounds of tests on different days, repeating all steps of sample preparation. Calculate the differences between values and the averages of the values from the two rounds of tests.
· When seven CRMs are used in the qualification procedures, at least six of the seven differences between duplicates obtained from any single analytes shall not exceed the limits shown in Table 1 and the remaining differences by no more than twice that value.
· For each analyte and each CRM, the average obtained shall be compared to the certified concentrations. When seven CRMs are used in the qualification procedure, at least six of the seven averages for each analyte shall not differ from the certified concentrations by more than the value shown in Table 1, and the remaining average by more than twice that value.
The maximum permissible variations in analysis results defined in ASTM C114-18 are listed in Table 1. ASTM C114-18 specifies NIST CRMs or other reference cements traceable to the NIST CRMs as acceptable reference cements.
In this application note, seven NIST CRMs (SRM1881a, 1884a, 1885a, 1886a, 1887a, 1888a and 1889a) were used for calibration and a qualification test.
Table 1: Maximum permissible variation (in mass%)
| Analyte | Maximum difference between duplicates | Maximum difference of the average of duplicates from the certified values |
| SiO₂ | 0.16 | ±0.2 |
| Al₂O₃ | 0.20 | ±0.2 |
| Fe₂O₃ | 0.10 | ±0.10 |
| CaO | 0.20 | ±0.3 |
| MgO | 0.16 | ±0.2 |
| SO₃ | 0.10 | ±0.1 |
| Na₂O | 0.03 | ±0.05 |
| K₂O | 0.03 | ±0.05 |
| TiO₂ | 0.02 | ±0.03 |
| P₂O₅ | 0.03 | ±0.03 |
| ZnO | 0.03 | ±0.03 |
| Mn₂O₃ | 0.03 | ±0.03 |
| Cl | 0.003 | ±0.005 |
Instrument
The Supermini200, a benchtop sequential wavelength dispersive X-ray fluorescence (WDXRF) spectrometer, is designed to minimize the peripherals in installation such as cooling water, power supply, installation area, etc. The Supermini200 has good sensitivity for light elements such as Na, Mg, P and Cl relative to EDXRF systems, and does not show any spectral overlap between typical analytes for cement raw meal, owing to high spectral resolution of the WD optics.
The Supermini200 is equipped with an air-cooled 200 W X-ray tube and up to three analyzing crystals, using which elements from fluorine to uranium can be analyzed.
The Supermini200 has the same base software as the ZSX Primus series and, therefore, the software is user-friendly and flexible.
Sample preparation
In general, sample preparation for X-ray fluorescence analysis is easier than other analytical methods.
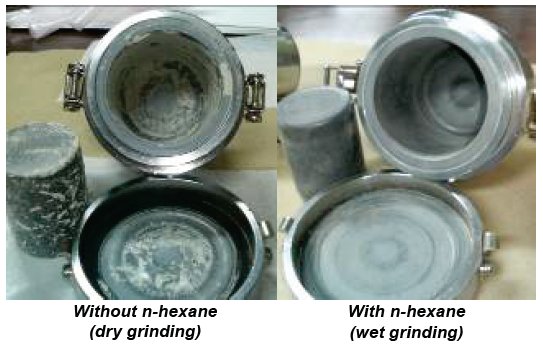
It is important to obtain fine grain size for samples when grinding to reduce the influence of grain size on the analysis results. To process many samples continuously, the cleaning of grinding containers to avoid contamination from previous samples should be able to be performed in a simple manner. When grinding cement samples, the samples can stick to the inner wall of the container, which causes a cleaning problem. To avoid this problem, n-hexane was added as a grinding agent to prevent the samples from sticking to the wall of the tungsten carbide container (the wet grinding method; see Figure 1).
A binder was mixed with the ground cement powder samples (the ratio of sample to binder was 10 to 1). Four grams of the mixture was pressed into an aluminum ring (inner diameter, 32 mm) at 150 kN.

Figure 1: Comparison of the condition in the container after pulverizing
Measurement
Measurements were performed in vacuum on the Supermini200 with a 200 W Pd target X-ray tube for the components listed in Table 1. Measurement conditions are shown in Table 2.
Table 2: Measurement conditions
| X-ray tube | Pd target, 200 W end-window type |
| Tube condition | 50 kV and 4.0 mA |
| Analysis area | 30 mm in diameter |
| Path atmosphere | Vacuum |
| Element | Si | Al | Fe | Ca | Mg | S | Na |
| Line | Kα | Kα | Kα | Kα | Kα | Kα | Kα |
| Primary filter | Out | Out | Out | Out | Out | Out | Out |
| Crystal | PET | PET | LiF | PET | RX26 | PET | RX26 |
| Detector | PC | PC | SC | PC | PC | PC | PC |
| Counting time (s) | 40 | 40 | 20 | 40 | 60 | 40 | 60 |
| Element | K | Ti | P | Zn | Mn | Cl | |
| Line | Kα | Kα | Kα | Kα | Kα | Kα | |
| Primary filter | Al | Out | Out | Out | Out | Out | |
| Crystal | PET | LiF | PET | LiF | LiF | PET | |
| Detector | PC | SC | PC | SC | SC | PC | |
| Counting time (s) | 40 | 20 | 40 | 60 | 60 | 60 |
Calibration
The results obtained in the calibration curves are shown in Table 3 and Figure 2.
A matrix correction method is applied to the calibrations. The symbol ○ shows the data point before the correction and the symbol ♦ shows the data after correction in the calibration charts.
The accuracy of calibration is calculated by the following formula:
$Accuracy = \sqrt{ \frac{\sum_i{(C_i-\hat{C}_i)^2}}{n-2} }$
$C_i$: calculated value of standard sample
$\hat{C}_i$: reference value of standard sample
n : number of standard samples.

Figure 2: Calibration curves of Portland cement
Table 3: Calibration results (unit: mass%)
| Analyte | Calibration range | Accuracy |
| SiO₂ | 18.637 – 22.38 | 0.15 |
| Al₂O₃ | 3.875 – 7.06 | 0.096 |
| Fe₂O₃ | 0.152 – 3.09 | 0.024 |
| CaO | 57.58 – 67.87 | 0.11 |
| MgO | 0.814 – 4.475 | 0.057 |
| SO₃ | 2.086 – 4.622 | 0.049 |
| Na₂>O | 0.021 – 1.068 | 0.0055 |
| K₂O | 0.093 – 1.228 | 0.0027 |
| TiO₂ | 0.084 – 0.366 | 0.0022 |
| P₂O₅ | 0.022 – 0.306 | 0.0014 |
| ZnO | 0.001 – 0.107 | 0.0009 |
| Mn₂O₃ | 0.007 – 0.259 | 0.0029 |
| Cl | 0.0019 – 0.013 | 0.0007 |
Qualification test for ASTM C114-18
Quantitative analyses were carried out for the seven NIST SRMs of Portland cement using the calibration curves obtained above. The results are listed in Table 4, comparing them with the values of ASTM C114-18 requirement.
Table 4: Qualification test results (unit: mass%)
| Analyte | Difference between duplicates | Difference of the average of duplicate from the certified values | ||
| Limit (ASTM) |
Maximum difference | Limit (ASTM) |
Maximum difference | |
| SiO₂ | 0.16 | 0.08 | 0.2 | 0.2 |
| Al₂O₃ | 0.20 | 0.03 | 0.2 | 0.1 |
| Fe₂O₃ | 0.10 | 0.01 | 0.10 | 0.04 |
| CaO | 0.20 | 0.12 | 0.3 | 0.2 |
| MgO | 0.16 | 0.03 | 0.2 | 0.1 |
| SO₃ | 0.10 | 0.06 | 0.1 | 0.1 |
| Na₂O | 0.03 | 0.005 | 0.05 | 0.01 |
| K₂O | 0.03 | 0.01 | 0.05 | 0.01 |
| TiO₂ | 0.02 | 0.003 | 0.03 | 0.004 |
| P₂O₅ | 0.03 | 0.003 | 0.03 | 0.003 |
| ZnO | 0.03 | 0.001 | 0.03 | 0.002 |
| Mn₂O₃ | 0.03 | 0.002 | 0.03 | 0.002 |
| Cl | 0.003 | 0.001 | N/A | 0.001 |
The results prove that the analysis method demonstrated in this application note meets the requirements described in ASTM C114-18.
Repeatability test
To demonstrate the stability of the instrument, the duplicated pressed pellets of NIST SRM 1889a were measured 10 times consecutively. The test results are listed in Table 5. The results show the good measuring precision.
Table 5: Repeatability test results (unit: mass%)
| Analyte | Certified value (SRM1889a) | Results of 10-time consecutive measurements | |||
| 1st pressed pellet | 2nd pressed pellet | ||||
| Average | Standard deviation | Average | Standard deviation | ||
| SiO₂ | 20.66 | 20.714 | 0.032 | 20.700 | 0.017 |
| Al₂O₃ | 3.89 | 3.857 | 0.007 | 3.851 | 0.010 |
| Fe₂O₃ | 1.937 | 1.915 | 0.005 | 1.917 | 0.008 |
| CaO | 65.34 | 65.349 | 0.031 | 65.388 | 0.026 |
| MgO | 0.814 | 0.882 | 0.005 | 0.879 | 0.004 |
| SO₃ | 2.69 | 2.671 | 0.004 | 2.695 | 0.005 |
| Na₂O | 0.195 | 0.194 | 0.006 | 0.193 | 0.005 |
| K₂O | 0.605 | 0.607 | 0.004 | 0.606 | 0.004 |
| TiO₂ | 0.227 | 0.227 | 0.005 | 0.226 | 0.007 |
| P₂O₅ | 0.11 | 0.111 | 0.001 | 0.112 | 0.001 |
| ZnO | 0.0048 | 0.0050 | 0.0000 | 0.0047 | 0.0005 |
| Mn₂O₃ | 0.2588 | 0.2590 | 0.0018 | 0.2607 | 0.0018 |
| Cl | 0.0019 | 0.0018 | 0.0004 | 0.0015 | 0.0005 |
As shown in Table 4, the obtained standard deviations of the repeatability test meet or exceed the ASTM C114-18 limits. The results demonstrate that the performance of the Supermini200 meets or exceeds the precision requirements for hydraulic cement analysis as stated in ASTM C114-18.
Conclusions
The qualification test for ASTM C114-18 demonstrated that the test results on the Supermini200 using pressed powder briquettes of wet-ground samples meet the requirements for analysis of hydraulic cement defined in ASTM C114-18.
The precision obtained by the repeatability test is much better than the defined values required in ASTM C114-18.
The Supermini200 is a wavelength dispersive benchtop X-ray fluorescence spectrometer equipped with a newly developed high-power air-cooled X-ray tube that does not require cooling water. The spectrometer configuration results in high sensitivity relative to benchtop energy dispersive XRF spectrometers for light elements such as Na or Mg, as well as for heavy elements.
Reference
(1) ASTM C114-18, Standard Test Methods for Chemical Analysis of Hydraulic Cement, 33pp.

