CrysAlisPro Tip
What is the Issue?
When does data become noise? Deciding how to define the resolution limits of your data is something that any two crystallographers will likely have differing opinions on. For electron diffraction data, mean I/σ(I) values are frequently low, and dynamical scattering complicates the use of R-values such as Rint for thresholding. The Pearson correlation coefficient CC1/2, often used in macromolecular X-ray crystallography to identify weak signals in high-resolution shells, is a useful reference when evaluating the limits of weak electron diffraction datasets. [Karplus & Diederichs, Science 336, 1030–1033 (2012)]
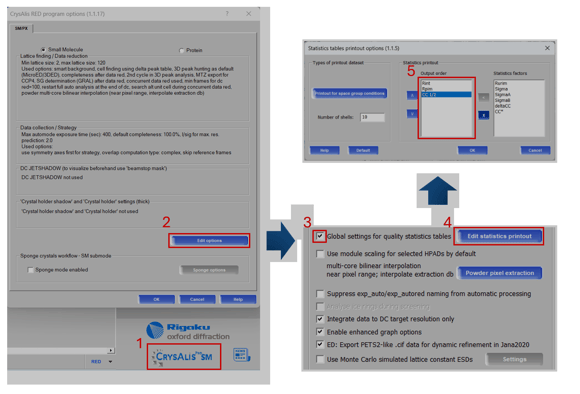
Figure 1. Global update to statistics table printouts
By default, CrysAlisPro does not output CC1/2 to the final statistics vs. resolution tables. To add it to all future datasets collected on your system, follow the procedure outlined in Figure 1 using the online version of CrysAlisPro on the data collection computer. Open the program options by clicking on program name (1.1), edit options (1.2), and select the check box (1.3) to globally update the printout options (1.4) to include statistics outside the default settings. The statistics placed in the output order box (1.5) will be printed in their respective order after data reduction.
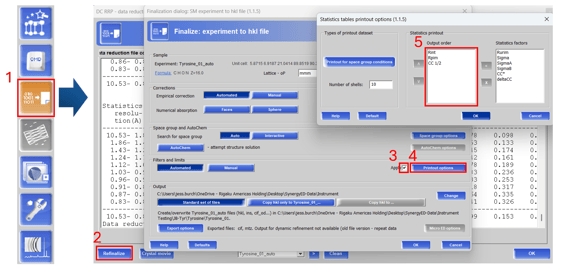
Figure 2. Update statistics table printouts for individual datasets
To update statistics tables for older datasets, open the data reduction viewer (2.1) and select refinalize (2.2). Under the filters and limits section, check apply (2.3) and click on the printout options (2.4). Add, remove, and re-arrange the statistics factors you would like to display (2.5). Then, refinalize the dataset to update the statistics tables.
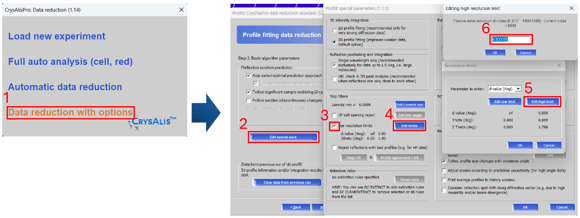
Figure 3. Changing resolution limits during data reduction
After evaluating the outcome of automated processing from CrysAlisPro, you may find that the default high-resolution limit of 0.8 Å is not ideal for your sample. If you need to include higher resolution data, then you need to re-integrate the data. This can be done by selecting the “start/stop” button and initiating data reduction with options (3.1). Click next twice to find the “edit special pars” option (3.2) and ensure that resolution limits are checked (3.3). Select edit limits (3.4) and adjust the high limit (3.5) to your desired value (3.6). Select “OK” on all windows and perform your integration and scaling.
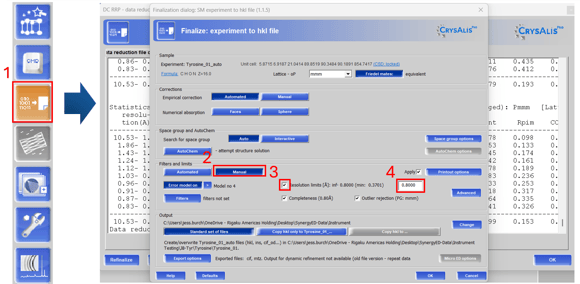
Figure 4. Changing resolution limits during refinalization
Follow the steps outlined in Figure 4 to trim high-resolution limits. Open the data reduction viewer (4.1) and select “manual” under the filters and limits (4.2). Check resolution limits (4.3) and set your desired value (4.4). This is particularly useful when working with merged datasets, where individual datasets may diffract to differing resolutions and the best value for the merged file is initially unclear. For electron diffraction datasets that are weak and prove tricky to solve, testing multiple resolution cutoffs can be helpful for obtaining an initial solution.
Author
Rigaku | Texas, USA
Jessica obtained her Ph.D. from UCLA, where she specialized in organic synthesis and the use of electron diffraction to determine the structures of small molecules. Prior to joining Rigaku, she was a staff scientist at Caltech, focusing on high throughput analysis of natural products and pharmaceuticals using electron diffraction. Want to learn more? Connect with Jessica Burch, PhD LinkedIn .

Subscribe to the Crystallography Times newsletter
Stay up to date with single crystal analysis news and upcoming events, learn about researchers in the field, new techniques and products, and explore helpful tips.

Contact Us
Whether you're interested in getting a quote, want a demo, need technical support, or simply have a question, we're here to help.