
Powder X-ray Diffraction Basic Course - Fourth Installment: Qualitative analysis
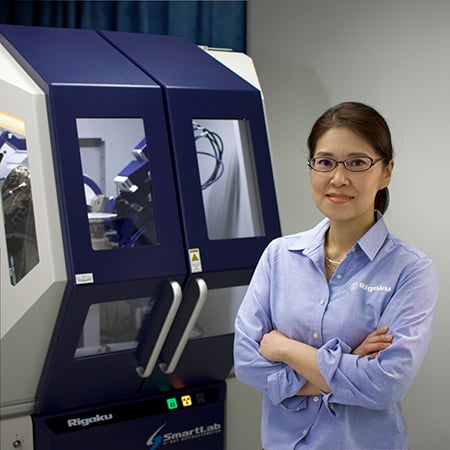
Miki Kasari
Winter 2022 Volume 38, No. 1 , 07-12
An essential feature of the qualitative analysis of the powder X-ray diffraction (PXRD) method is that this provides information on the sample’s crystal structure, which often affects the properties and functions of the material. The qualitative analysis by the PXRD method is a phase identification method based on the matching of known patterns (Card) in with measurement patterns. Tips in the phase identification procedure are the quality of the measurement data, the presence of trace phases, and the selection of card. In recent years, the performance of analysis software has been improved, and phase identification can now be done quickly and easily by a computer search. Since the results of computer searches are not always correct, analysts need to evaluate the validity of the analysis results themselves.

Highlights
- Powder X-ray diffraction identifies crystalline phases by matching measured peak positions and relative intensities to reference patterns in a database.
- It can reveal structural differences that elemental methods cannot, including distinguishing polymorphs such as anatase and rutile even when the chemistry is the same.
- Reliable phase identification depends heavily on high-quality data, including good alignment, proper sample preparation, and accurate peak detection.
- Automated search/match software speeds up analysis, but the results still need expert review because false matches and poor-quality reference cards can mislead the user.
- Trace phases are especially challenging; small peaks must be checked carefully to separate real signals from noise, unwanted X-ray lines, or contributions from holders and accessories.
Summary
Qualitative XRD is used to figure out which crystalline substances are present in a sample. Each crystal structure produces a characteristic diffraction pattern, so the basic idea is to compare the measured pattern with stored reference patterns and look for a good match. A good match is not based only on where the peaks appear, but also on how strong they are relative to each other.
This approach is powerful because it gives structural information, not just elemental composition. That means it can tell apart materials that contain the same elements but are arranged differently in the crystal, and it can also help distinguish crystalline material from amorphous or liquid-like material.
In practice, the process usually starts with peak detection and background handling, followed by a database search. Modern software can automatically propose likely phases, including mixtures, by comparing the observed peaks with reference cards and subtracting matched phases step by step. Even so, the first answer from the software should not be accepted blindly. The user still has to judge whether the suggested phases make chemical and experimental sense.
A major lesson is that data quality controls the outcome. Poor alignment, coarse particles, preferred orientation, weak crystallinity, or noisy data can shift peaks, distort intensities, or broaden profiles, which makes identification harder. For low-level components, it may also help to combine XRD with elemental information from XRF.
Frequently asked questions
-
It tells you which crystalline phases are present in a sample. The method works by comparing the measured diffraction pattern with known reference patterns in a database. If the peak positions and relative intensities line up well enough, the corresponding phase is considered present.
-
Elemental methods tell you what atoms are present, but not how those atoms are arranged. XRD adds crystal-structure information, which often controls material properties and performance. That is why XRD can separate phases that have the same chemistry but different structures.
-
Yes. A classic case is polymorphism, where one chemical composition can exist in more than one crystal structure. Because each structure has a different diffraction pattern, XRD can distinguish them as separate phases.
-
Search/match software is only as good as the input data and the reference cards it compares against. Low-quality measurements, trace components, poor peak extraction, overlapping peaks, and lower-quality cards can all produce misleading candidates. The results need to be checked against sample history, expected chemistry, and overall pattern agreement.
-
Several common issues can distort the diffraction profile: poor crystallinity broadens peaks, preferred orientation changes relative intensities, solid solution effects can shift peaks, strain can broaden or split them, and stacking faults can create tailing or asymmetry. Any of these can make a correct match less obvious.
-
Modern workflows usually identify the strongest matching phase first, subtract its contribution, and then search again using the remaining peaks. Repeating that process helps uncover multiple phases in the same sample. The resulting candidate list still needs review to remove unrealistic or weakly supported matches.
-
Small peaks should be checked carefully. Some may be background noise, some may come from unwanted characteristic X-ray lines such as Kβ or tungsten-related signals, and some may come from the holder or accessory film rather than the sample itself. Signal-to-noise thresholds and manual peak review are important when looking for minor phases.
Related products
Subscribe to the Bridge newsletter
Stay up to date with materials analysis news and upcoming conferences, webinars and podcasts, as well as learning new analytical techniques and applications.
Contact Us
Whether you're interested in getting a quote, want a demo, need technical support, or simply have a question, we're here to help.