Application Note B-XRD1114
Introduction
Quantification of a trace amount of polymorphic impurities is critical especially in the quality control of Active Pharmaceutical Ingredients (APIs). Conventional quantitative analysis by X-ray diffraction (XRD) requires calibration curve preparation, reference intensity ratio (RIR) or crystal structure (Crystallographic Information File, CIF). However, the materials of APIs are often missing from the database. Therefore, their quantification is not straightforward. Rigaku have developed a novel quantitative analysis method called “Direct Derivation (DD)” that requires only XRD data and chemical formula(1)-(3). Here, quantitative analysis of trace amounts of the hydrate phase of API is performed using the DD method and the limit of quantification (LOQ) is calculated.
Measurements and results
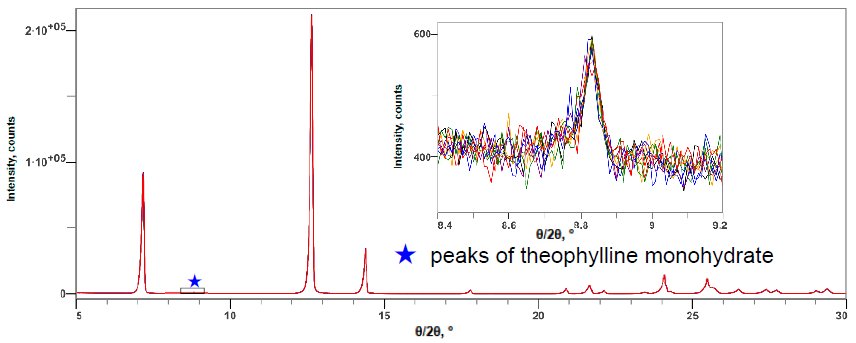
Figure 1 shows the X-ray diffraction profiles of anhydrous theophylline and theophylline monohydrate. Figure 2 shows the X-ray diffraction profile of a mixture of anhydrous theophylline and 0.10 mass% theophylline monohydrate. The 2θ range of 5 to 120˚ was measured at 10˚/min, thus one measurement took about 12 minutes. The LOQ was calculated from the 10 simple iterative measurements. Table 1 shows the results of quantitative analysis and the LOQ. Although the DD method is simple, it was found to have a LOQ comparable to the calibration curve methods.

Figure 1: Multiple X-ray diffraction profiles of the anhydride and monohydrate of theophylline (Excerpts of 2θ = 5 to 60°)

Figure 2: Multiple X-ray diffraction profiles of the anhydride and 0.10 mass% monohydrate mixture of theophylline (10 simple repeat measurement results)
Table 1: Quantitative value average and quantitative lower limit of theophylline monohydrate
| Preparation value | 0.10 |
| Quantitative value | 0.11±0.004 |
| Limit of quantification | 0.04 |
References
(1) H. Toraya: J. Appl. Cryst., 49 (2016) 1508-1516.
(2) H. Toraya: Rigaku Journal (English version), 34 (1) (2018) 3-8.
(3) H. Toraya: J. Appl. Cryst., 50 (2017) 820–829.

