Application Note B-XRD2027
Introduction
Crystallographic non-uniformity of single crystal substrates and buffer layers, such as defects and orientation distribution, may decrease the performance of thin-film devices. XY mapping of the rocking curve allows us to evaluate the in-plane uniformity of single crystal substrates and buffer layers visually and quantitatively.
Measurements and results
MgO 002 (diffraction angle 2θ=43.08˚ ) rocking curve measurement (ω scan) was performed on a 10 mm × 10 mm MgO substrate, with 0.5 mm intervals in the X and Y directions using a 0.5 mm φ incident X-ray beam.
Figure 1 shows the color map of the position of the most intense peak observed in each profile. A change in peak position was observed over the entire MgO substrate. This indicates that the inclination of the MgO 002 lattice plane was non-uniform across the sample. Figure 2 compares profiles collected at the measurement positions marked with the dashed lines in Figure 1 (X = -2.0 mm, Y = -4.5 to +5.5 mm). The profiles at Y= +1 to +2.5 mm, which corresponds to the "red" part in Figure 1 (a) , showed 0.055˚ higher-angle peak positions than other parts. This indicates that the MgO 002 lattice planes of this section tilt against the other parts of the sample.
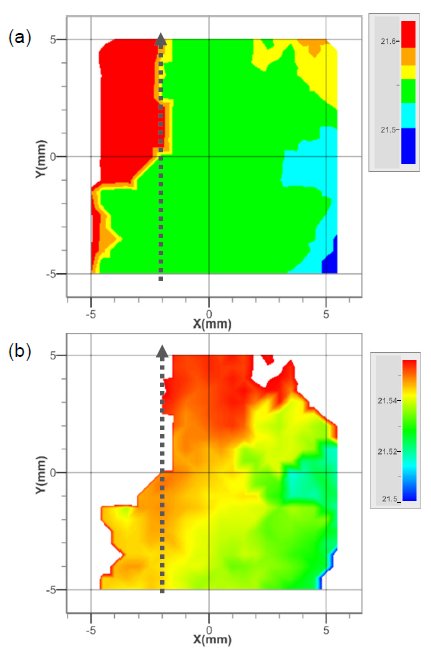
Figure 1: Color maps of MgO 002 rocking curve peak position. (a) Full range map, (b) emphasizing medium range
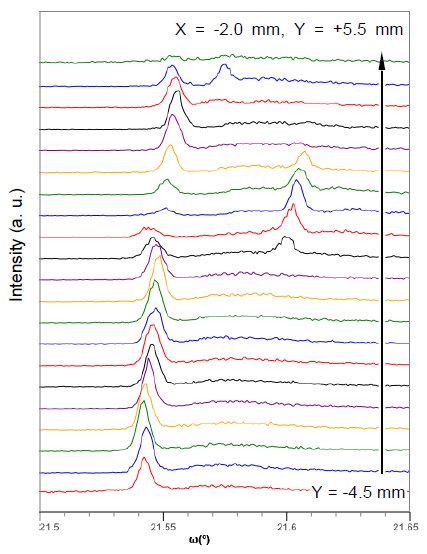
Figure 2: MgO 002 rocking curve profiles collected at X = -2.0 mm, Y = -4.5 to 5.5 mm.
