About the calculator
The calculator calculates peak-to-background (P/B) ratio and standard deviation of X-ray count with a P/B ration in consideration.
How to use it
- Enter the total X-ray intensity at the peak position in [counts] unit.
- Enter the background level in [counts] unit.
Theory
Variables
| Symbol | Meaning | Units |
|---|---|---|
| T | Total X-ray counts | counts |
| P | Peak only X-ray counts | counts |
| B | Background level | counts |
| P/BM | Peak-to-background ratio | — |
| σT/T | Relative standard deviation based on total X-ray | counts |
| σ/T | Relative peak standard deviation with background consideration | counts |
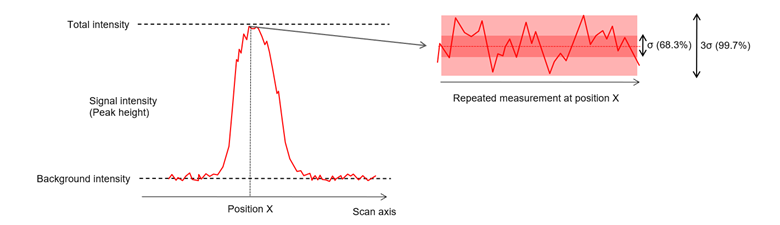
The peak-to-background ratio is defined as P/B. The peak intensity is calculated as P = T – B.
The relative standard deviations based on total X-ray count is determined as:
\(\frac{\sigma_T}{T} = \frac{1}{\sqrt{T}}, \text{ where } \sigma_T = \sqrt{T}.\)
The relative standard deviations with background consideration is determined as:
\(\frac{\sigma}{T} = \frac{\sqrt{T + B}}{P}.\)