Application Note B-XRD2038
Introduction
Metal thin films are widely used as diffusion barriers between Cu interconnects and Si substrates in semiconductor devices. Their performance strongly depends on the film thickness and structure. Localized thinning of metal film may lead to Cu diffusion and variations in electrical properties. For large-diameter wafers, the in-plane uniformity of the film structure is critical to device yield, making full-wafer evaluation essential.
The Rθ attachment (Fig. 1) enables full-wafer measurements of 8-inch wafers by combining radial translation (R axis) and rotation (θ axis), which cannot be achieved with a conventional XY attachment. In this example, X-ray reflectivity (XRR) was used to evaluate the thickness, density, and surface/interface roughness of metal thin film deposited on an 8-inch Si wafer.
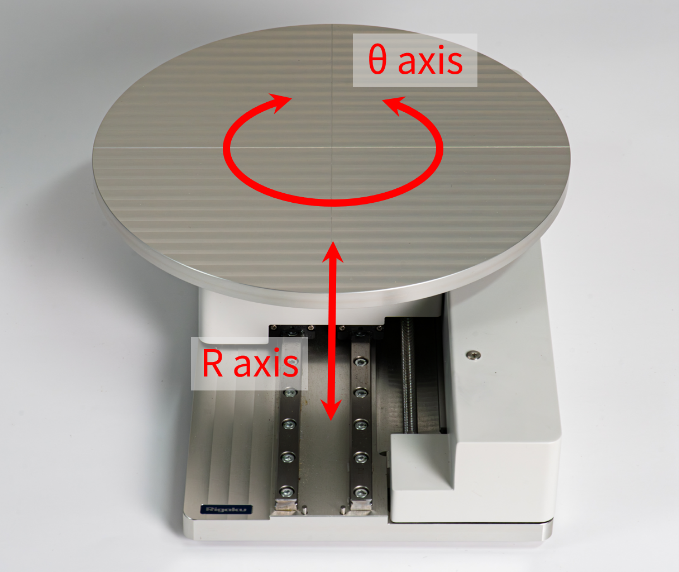 Fig. 1: Rθ attachment
Measurements and Results
An 8-inch Si wafer with Ta film (nominal thickness: 20 nm) was evaluated. Fig. 2 shows the measured XRR profile and fitting results at the wafer center. The structural model comprised a native Ta₂O₅ surface oxide layer and a low-density interfacial transition layer between the Ta film and Si substrate. The thickness, density, and roughness of each layer were determined by profile fitting.
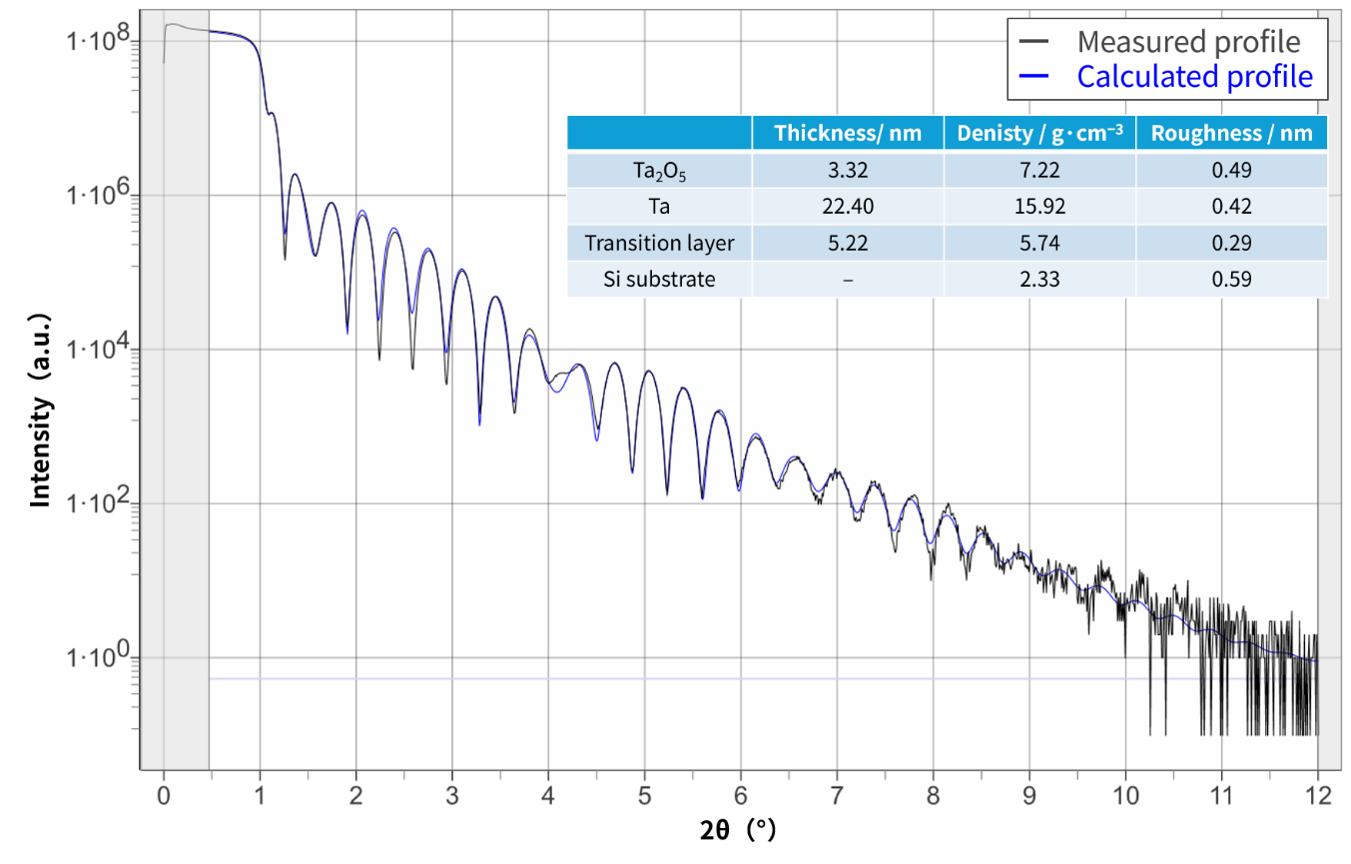 Fig. 2: The result of XRR analysis
The calculated XRR profile showed good agreement with the measured profile, suggesting the existence of a 3.32-nm-thick Ta oxide layer on the sample surface and a 5.22-nm-thick transition layer at the interface between film and substrate. The density of the Ta oxide layer was lower than that of bulk Ta2O5 (8.3 g cm⁻³), indicating the presence of an amorphous phase, structural defects, or voids. In contrast, the density of the transition layer was higher than those of Si (2.32 g cm⁻³) and SiO₂ (2.20 g cm⁻³), suggesting that the layer may consist of a Ta–Si–O interfacial mixed layer formed by interactions with the Si substrate, native Si oxide layer, and deposited Ta during film growth.
To evaluate the in-plane distribution of the film structure, full-wafer mapping XRR measurement and analysis were performed. Fig. 3 shows color maps of the analyzed structural parameters. Across the entire 8-inch wafer, Ta oxide and transition layers exhibited thicknesses of approximately 3.2 nm and 5 nm, respectively. No distinct spatial variation was observed, indicating that both layers are stable and uniformly formed across the wafer by natural oxidation and initial interfacial reactions during deposition.
In contrast, the Ta film thickness showed a concentric distribution centered near the lower-right region of the wafer. The thickness was approximately 22.5 nm at the center and decreased to about 19.5 nm near the wafer edge. An in-plane variation in Ta film density was also observed. A relatively high density of approximately 16.5 g cm⁻³ was observed in the upper-right region, whereas the density was below 15 g cm⁻³ in the lower-left edge region.
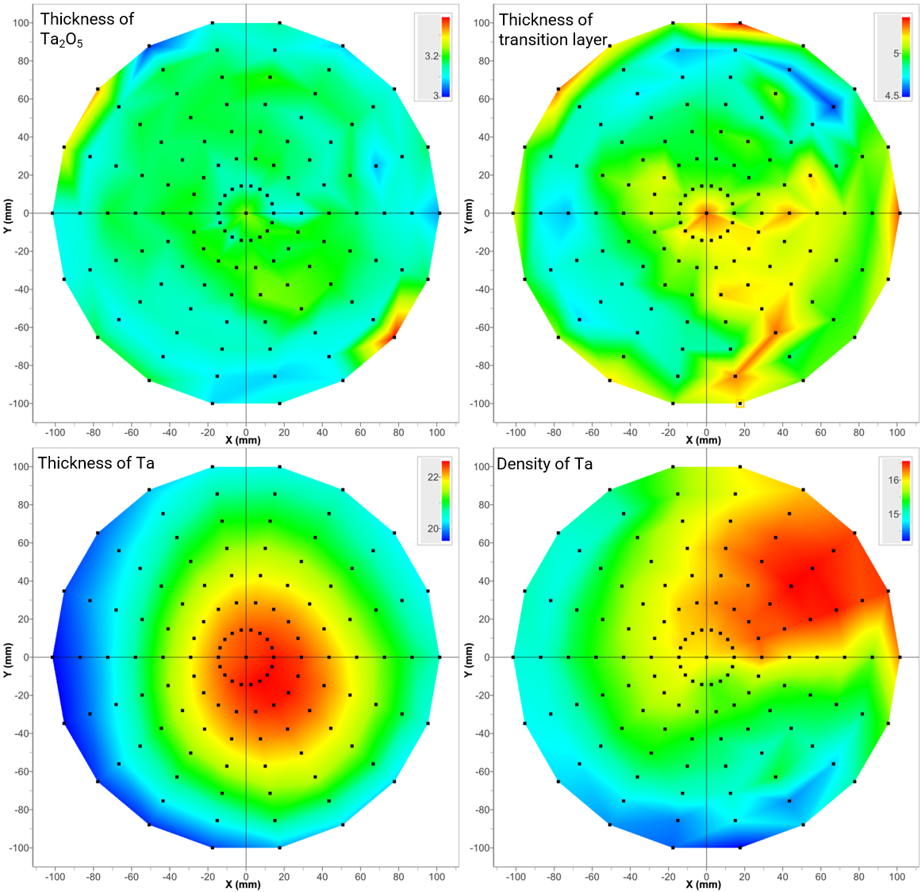 Fig 3: Results for each layer
As demonstrated above, the Rθ attachment enables full-wafer mapping and visualization of metal thin film structures on 8-inch wafers, including the main film layer, surface oxide layer, and interfacial transition layer.
References
- XPS depth-profile of the suboxide distribution at the native oxide/Ta interface (2009)
M. Khanuja, H. Sharma, B.R. Mehta, S.M. Shivaprasad; Journal of Electron Spectroscopy and Related Phenomena, 169, 41−45. - Interface formation and reactions at Ta–Si and Ta–SiO₂ interfaces studied by XPS and ARXPS (2004)
M. Zier, S. Oswald, R. Reiche, M. Kozlowska, K. Wetzig; Journal of Electron Spectroscopy and Related Phenomena, 137−140, 229−233.
Recommended equipment and software
- SmartLab automated multipurpose X‑ray diffractometer+ Rθ Attachment
- SmartLab Studio II integrated X-ray analysis software (XRR, Data Visualization Plugin)