Application Note B-XRD1172
Introduction
Rare earth elements are important resources that support advanced industries such as permanent magnets, electric vehicles, and wind power generation. In general, rare earth elements occur in fluorocarbonate minerals and phosphate minerals, but they may also be present in an adsorbed state on clay minerals. Because these elements can be found in a variety of mineral phases and occurrence modes, beneficiation and smelting processes must be selected based on the characteristics of the ore and the particular occurrence mode.
For ores containing multiple minerals, it is necessary to both identify the constituent minerals and quantify each mineral phase. X-ray diffraction (XRD) is an effective analytical technique for identifying the crystalline phases of rare earth minerals and associated minerals. Furthermore, the fraction of each identified crystalline phase can be quantitatively evaluated using Rietveld refinement. This information can be utilized for the optimization of beneficiation and smelting processes as well as for resource evaluation.
This application note presents an example of phase identification and quantitative phase analysis of rare earth ores using Rietveld refinement with the MiniFlex XpC compact X-ray diffractometer.
Measurements and results
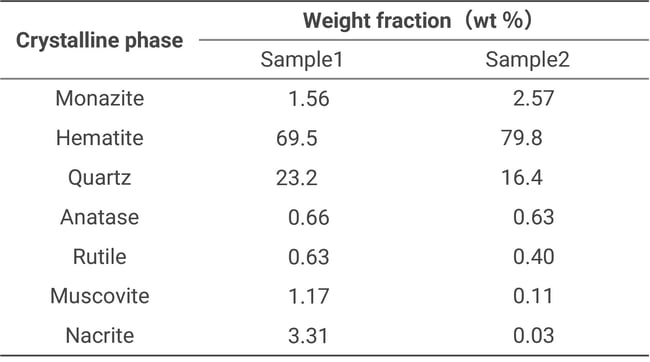
Diffraction data of samples containing rare earth elements, designated as Sample1 and Sample2, were collected in approximately 10 minutes using the MiniFlex XpC compact X-ray diffractometer. The phase identification results are shown in Figure 1. Monazite-(Ce) [(Ce,La,Nd,Th)PO₄] was identified as the primary rare earth-bearing mineral in both samples. Hematite, quartz, anatase, rutile, muscovite, and nacrite were also identified as associated minerals. The quantitative analysis results obtained using the Rietveld refinement are shown in Table 1.
Differences in the abundances of hematite, quartz, muscovite, and nacrite were observed between Sample1 and Sample2, indicating distinct mineral compositions. These results demonstrate that the MiniFlex XpC can identify crystalline phases from diffraction data collected in approximately 10 minutes and quantify them using Rietveld refinement. This approach provides valuable information for understanding ore characteristics and optimizing beneficiation and smelting processes.

Fig.1: Results for Sample1 and Sample2
Note: The intensity axis is displayed with an offset.
Table 1: Weight fractions of crystalline phases of Sample1 and Sample2
Recommended equipment and software
- MiniFlex XpC compact X-ray diffractometer
- MiniFlex benchtop X-ray diffractometer
- SmartLab SE or SmartLab automated multipurpose X-ray diffractometers
- SmartLab Studio II integrated X-ray analysis software (Powder XRD Plugin)