Application Note B-XRD1119
Introduction
Polymers are generally long-chained semi-crystalline materials. They are made up of long, carbon chain structures that can be analyzed by XRD. XRD can determine the identity of the polymer, degree of crystallinity, crystallite size and crystallite orientation. An important property of polymer films is their ability to stretch. This property can be influenced by thermal treatments and forming processes. By evaluating the crystal orientation focusing specifically on the c-axis and the degree of the orientation, the yield stress and strain (“stretchiness”) of polymer films can be predicted. The beta scan in the transmission θ/2θ arrangement is commonly used as a method to evaluate the orientation. Analysis using a whole pole figure that is obtained from reflection and transmission pole figure measurement allows you to understand the degree of orientation in more detail. Furthermore, it is possible to evaluate the orientation distribution quantitatively by using Herman’s orientation function(1),(2) which is calculated from the whole pole figure.
Measurements and results
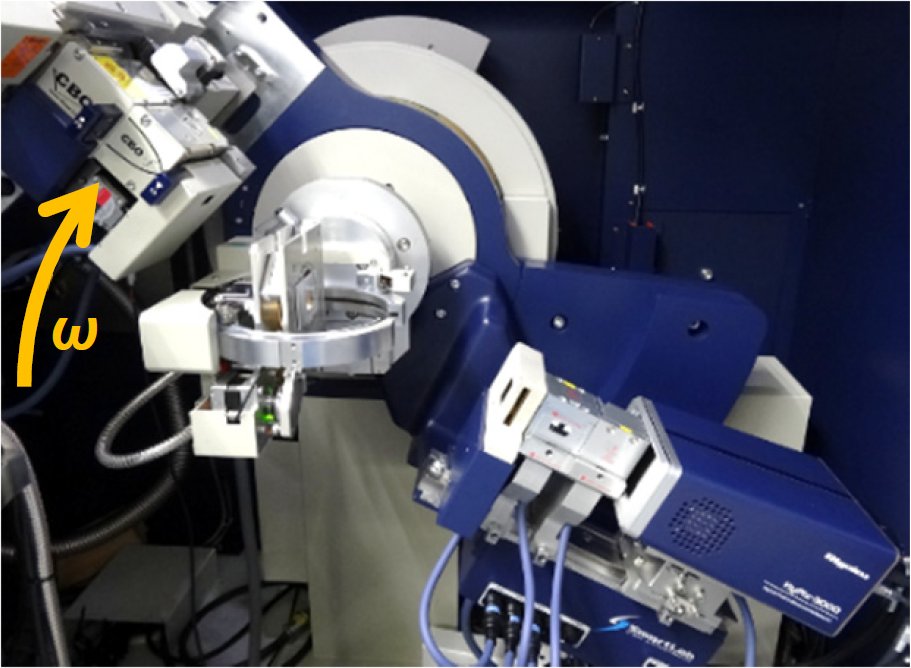
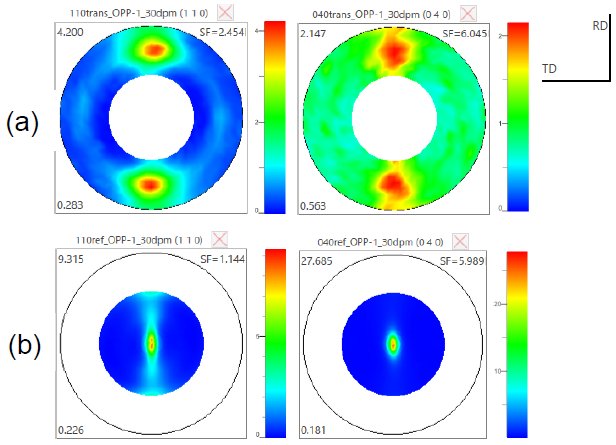
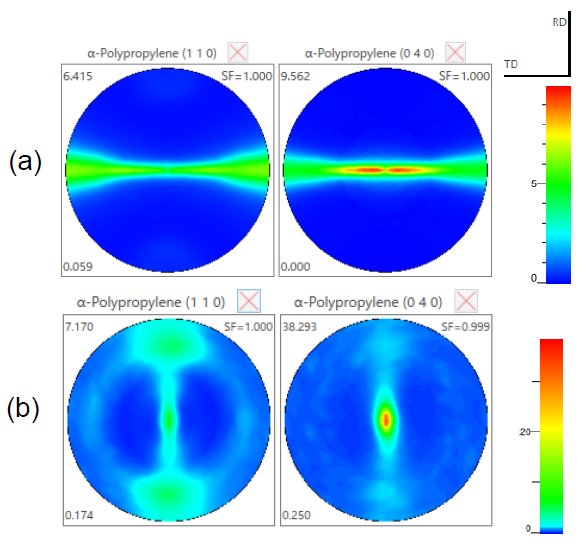
The omega axis is used to change the alpha value in the transmission pole figure measurement while the chi axis is used to change the alpha in the reflection pole figure measurement (Figure 1). Figure 2 shows a pole figure of Polypropylene (PP) film. The transmission pole figure provides information near the outside of the pole figure, while the reflection pole figure has information near the center of the pole figure. Figure 3 (b) shows whole pole figures after background and absorption correction and integration. Table 1 shows the orientation function values of uniaxially and biaxially stretched PP films. This orientation function quantitatively expresses the distribution of how strongly the lattice plane normals, and the a, b, c-axes are oriented toward the ND, TD and RD (Normal, Transverse and Rolling Directions). It was found that the majority of c-axes in the uniaxial PP are oriented to the RD and those in the biaxial PP to the TD. As described above, these quantitative orientation distributions can be related to the material properties of that film and can be used for extensive film orientation studies.

Figure 1: Instrument configuration for transmission pole figure measurement.

Figure 2: 110, 040 pole figures of PP biaxial stretching film (a) Transmission (b) Reflection method.

Figure 3: 110, 040 whole pole figures of PP film (a) Uniaxial (b) Biaxial stretching.
Table 1: Orientation function from Figure 3 (a) Uniaxial (b) Biaxial stretching.
| (a) | ND | RD | TD |
| {0 4 0} | 0.406 | 0.079 | 0.516 |
| {1 1 0} | 0.555 | 0.032 | 0.414 |
| a axis | 0.382 | 0.105 | 0.513 |
| b axis | 0.555 | 0.032 | 0.414 |
| c axis | 0.054 | 0.885 | 0.061 |
| (b) | ND | RD | TD |
| {0 4 0} | 0.596 | 0.249 | 0.155 |
| {1 1 0} | 0.312 | 0.476 | 0.212 |
| a axis | 0.280 | 0.493 | 0.227 |
| b axis | 0.596 | 0.249 | 0.155 |
| c axis | 0.120 | 0.252 | 0.628 |
References
(1) P.H. Hermans and P. Platzek: Kolloid Z. 88(1939) 68-72.
(2)R.S. Stein: J. Polymer Sci., 31(1958) 327-334.

