Application Note B-XRD1002
Introduction
The calibration curve method is the most common method for quantitative analysis using X-ray diffractometry. However, there are cases where this method cannot be used due to problems involving obtaining the standard samples needed for plotting calibration curves, and the time needed to prepare and measure samples. In these cases, quantification using the RIR (Reference Intensity Ratio) method enables quantitative analysis without the complication of sample preparation and measurement. In the RIR method, quantitative values are easily calculated, using RIR values listed in a database, from integrated intensity of the maximum intensity curves of the examined components. This makes it possible to calculate quantitative values without plotting calibration curves.
Measurements and results
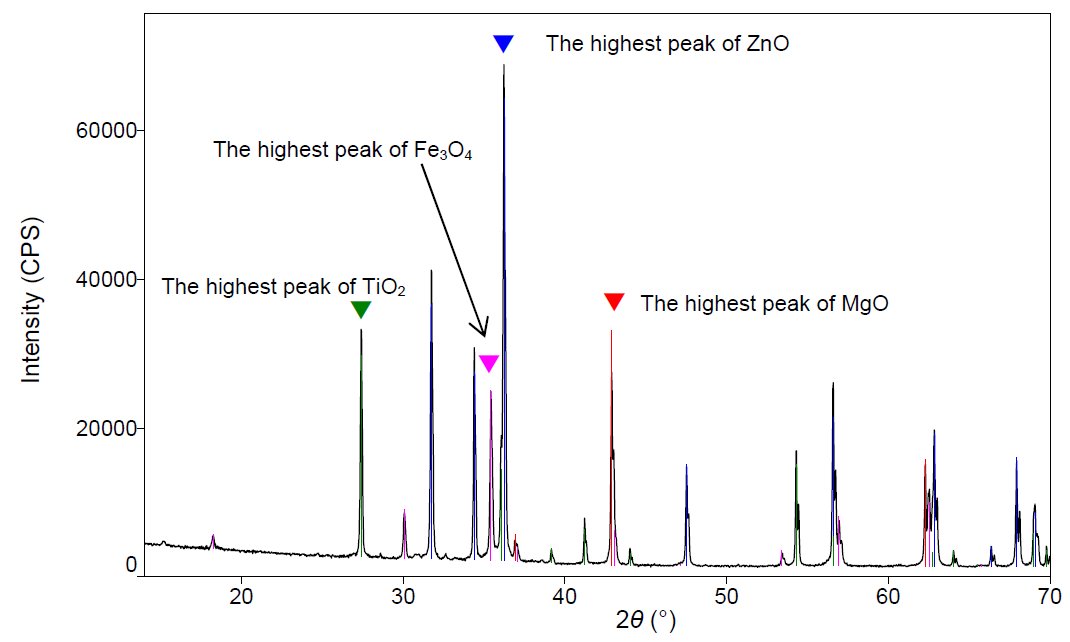
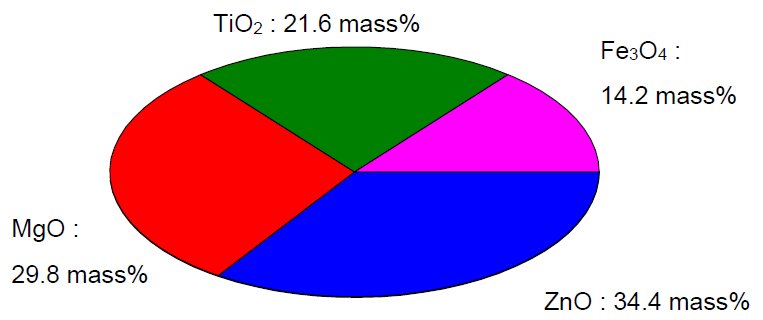
Qualitative analysis was conducted, as shown in Figure 1, by measuring a sample comprised of four components. Next, analysis was conducted, using the RIR method, based on the integrated intensity of the diffraction peaks indicated by the ▼ marks (i.e., the peaks of the maximum intensity curves for each component). The obtained analysis results were extremely close to the sample preparation values, as indicated in Table 1 and Figure 2.

Figure 1: Qualitative analysis results for a powder sample comprised of four components

Figure 2: Graph of quantitative results obtained using the RIR method
Table 1: Components of the measurement sample the results of quantification using the RIR method
| Components | Amounts of preparation | Quantitative value (%) |
| ZnO | 35.8 | 34.4(6) |
| MgO | 26.3 | 29.8(8) |
| TiO₂ | 24.7 | 21.6(4) |
| Fe₃O₄ | 13.2 | 14.2(2) |

