Application Note B-TA1085
Introduction
Polymethyl methacrylate (PMMA) is a representative amorphous polymer widely used as an optical and industrial material. Since amorphous polymers do not exhibit the distinct melting behavior observed in crystalline materials, it is difficult to directly observe and evaluate changes in sample viscosity during heating using conventional thermal analysis methods such as DSC.
In this application, a STA system with a sample observation function and ChromTA™ (Chromatic Thermal Analysis) was used to evaluate the thermal behavior of amorphous PMMA powder during heating, based not only on thermal analysis curves and images but also on changes in the sample’s appearance surface color.
Measurement and analysis example
Measurements were performed using STA equipped with a sample observation unit. Amorphous PMMA powder (10.21 mg) was heated from room temperature to 280 °C at a heating rate of 3 °C/min under a nitrogen atmosphere (300 mL/min).
During the measurement, TG‑DSC data were acquired while the sample surface was continuously monitored, and the obtained image data were analyzed using ChromTA. Four types of color‑space data (RGB, CMYK, HSV, and Lab*) were created and synchronized with temperature and time to evaluate the correlation between thermal events and changes in appearance (structure).
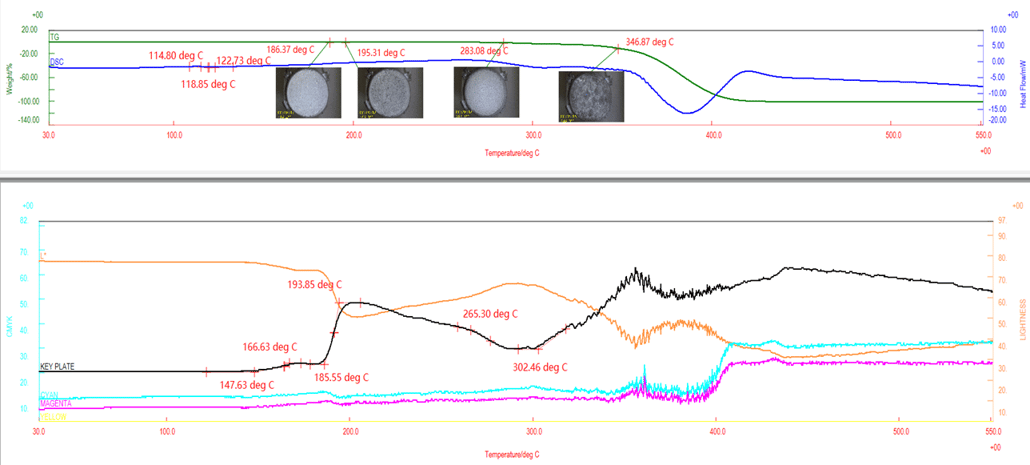
Figure 1: Synchronized graph of TG‑DSC results and color changes (CMYK) analyzed by ChromTA
Figure 1 shows synchronized graph of TG‑DSC results and color changes (CMYK) analyzed by ChromTA.
In the DSC curve, a baseline shift towards the endothermic direction corresponding to the glass transition was observed in the temperature range of 110 °C to 120 °C.
In contrast, ChromTA analysis revealed changes in CMYK color parameters starting at approximately 148 °C, and morphological changes in the sample’s particle shape began to appear within this temperature range. Around 186 °C, a pronounced color change, particularly in the K value (key plate), was observed, accompanied by a significant change in sample viscosity, which was captured both visually and quantitatively. With increasing temperature, the particle shape gradually became more spherical, and subsequent aggregation of the particles was observed, leading to an increase in particle size. Around the inflection point at approximately 265°C, foaming of the sample was observed concurrently with a change in viscosity; when mass loss due to decomposition began at 300°C and above, significant and abrupt noise-like fluctuations indicative of foaming appeared in the color parameters.
By combining sample observation STA with ChromTA, it was demonstrated that the entire processes in amorphous PMMA—from glass transition through morphological change, viscosity change, particle agglomeration, and even the start of decomposition from foaming—can be continuously monitored in synchronization with temperature.
In polymer manufacturing and molding processes, it is essential not only to control temperature but also to accurately understand viscosity changes associated with increasing temperature. Particularly for amorphous polymers, visualizing such correlation is key to optimizing molding conditions and reducing defects. ChromTA provides a powerful method for visualizing and quantifying viscosity‑related changes that are difficult to capture by conventional thermal analysis, and offers valuable insights for viscosity control processes.