Application Note B-TA1082
Introduction
Polyethylene terephthalate (PET) is widely used as a packaging and industrial material, and evaluation of its thermal behavior associated with thermal history is an important factor that governs material properties.
In this application, a STA equipped with sample‑observation function combined with ChromTA™ (chromatic thermal analysis) was used to evaluate thermal events of amorphous PET during heating process based on thermal analysis curves, image data, and structural changes reflected in the appearance color of the sample.
Measurement and analysis example
Measurements were performed using STA equipped with a sample observation unit. An amorphous PET pellet with a mass of 14.567 mg was heated from room temperature to 280 °C at a heating rate of 3 °C/min under a nitrogen atmosphere (300 mL/min).
During the measurement, TG‑DSC data were acquired while the sample surface was continuously monitored by imaging, and the obtained image data were analyzed using ChromTA.
Four types of color‑space data (RGB, CMYK, HSV, and Lab*) were calculated from the image data and synchronized them with temperature and time, enabling evaluation of the correlation between thermal events and appearance‑based structural changes.
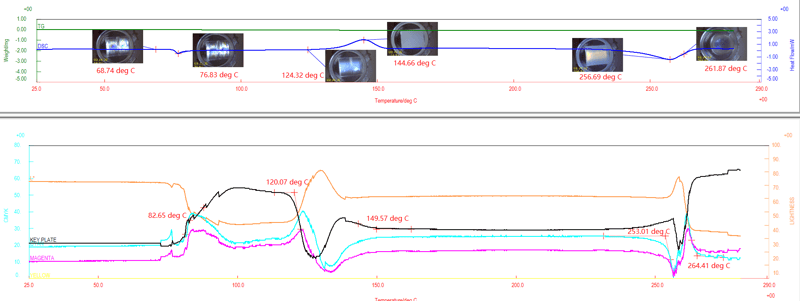
Figure 1: Synchronized plots of TG‑DSC results and color tone changes analyzed by ChromTA for amorphous PET pellet.
Figure 1 shows synchronized plots of TG‑DSC results and color tone changes analyzed by ChromTA for the amorphous PET pellet.
On the DSC curve, a baseline shift due to the glass transition was observed in the low‑temperature range of 70–90 °C. Within this temperature range, ChromTA analysis revealed pronounced changes in color parameters, including the L* value, synchronized with image changes. This indicates that the change in molecular mobility from the glassy state to the rubbery state, characteristic of amorphous materials, is reflected in the optical properties of the sample, providing useful supplementary information for evaluating glass transition behavior.
Upon further heating after the glass transition, a clear exothermic crystallization peak was observed in the DSC curve at 145 °C. In the same temperature range, ChromTA analysis showed significant changes in all color parameters, clearly demonstrating that microstructural changes associated with crystallization (nucleation and growth processes) are reflected in changes in the appearance color of the sample. Furthermore, a temperature range around 150 °C was identified where the color‑parameters change converged to constant values, indicating that not only the reaction progression but also the completion of crystallization can be captured visually and quantitatively. In addition, the onset of color changes was observed at a slightly lower temperature, around 120 °C, than the onset temperature of the DSC peak, suggesting that ChromTA is effective for detecting the early stage of crystallization.
At higher temperatures, an endothermic melting peak was observed in the DSC curve at 256 °C. In this temperature range, discontinuous changes in color parameters were detected, reflecting changes in the sample state associated with the disappearance of crystalline structure; however, depending on the temperature range, changes in the color parameters were also observed that could not be explained by simple melting behavior alone, suggesting the possibility that localized or transient recrystallization occurs simultaneously with melting.
By combining sample image observation with ChromTA analysis, a series of thermal behaviors of amorphous PET—glass transition, crystallization, and melting—can be evaluated from both thermal analysis curves and color information. ChromTA is effective for capturing precursors and heterogeneity of structural changes that are difficult to detect by conventional thermal analysis alone making it a high-value-added material evaluation method for the analysis and research and development of various materials.
