CrysAlisPro Tip
Running Variable Temperature / Wavelength Experiments
Introduction
Whether you seek to study temperature-related changes in crystals or to refine a crystal structure with data collected at different wavelengths, CrysAlisPro allows for the collection of a series of consecutive datasets at different temperatures or wavelengths without any user intervention between datasets. This is because the temperature or wavelength changes can be incorporated into the data collection strategy. CrysAlisPro will proceed as usual with automatic data processing and structure solution concurrently to each data collection and save each dataset into a separate folder. At the end of the series, you will find the diffraction images, processed data, and structure files stored in their usual locations in each dataset folder.
Calculate and save the strategy(ies) to be used for collection at various temperatures/wavelengths
- Run a pre-experiment and calculate a strategy, as usual.
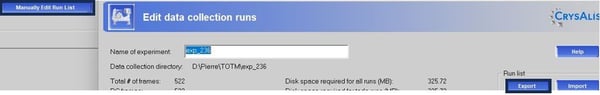
- In the strategy interface, select Manually Edit Run List. Then, select Export and save the strategy as a *.run file.
Note 1: If you are running a multiple-wavelength experiment, you must run a pre-experiment and calculate a strategy for each wavelength.
Note 2: If you are running a variable-temperature experiment and a temperature-dependent phase transition occurs:
- If the phase transition’s temperature is known: run a pre-experiment above and below this temperature and calculate a strategy for each structural phase.
- If the phase transition’s temperature is unknown: you must ensure a complete dataset is collected for each phase. You may use the strategy for the lowest symmetry lattice of the two phases or calculate a strategy for a full sphere.
Run a multi-wavelength experiment
1. Select the multi-wavelength/temperature icon in the left column of icons:

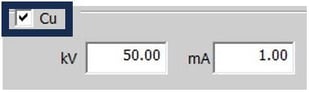
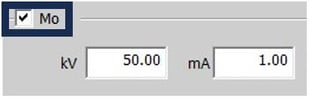
2. Ensure the box near each wavelength is selected (your system may have a different configuration from the one shown below; i.e., Cu/Ag or Mo/Ag).
3. For each wavelength, select the Strategy 1 button to open the strategy interface.
4. Select Manually Edit Run List and then Import.
5. Using File Explorer, browse to the *.run strategy file created upon running the pre-experiment and select OK.
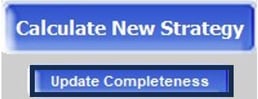
6. At the top left, enter the detector distance for which the strategy was calculated (strategy files do not contain detector distance information) and select Update Completeness.
With the strategy ready, the OK button is now enabled. Select OK to close the interface.
Note: Do not select Calculate New Strategy.
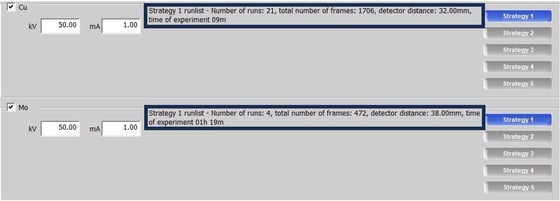
7. The interface should now look as shown below, with the data collection parameters displayed for each experiment:
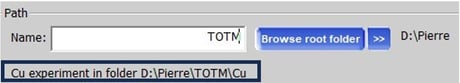
8. At the top of the dialog, select Browse root folder to select/create the project folder where the datasets will be saved and enter a name for the experiment.
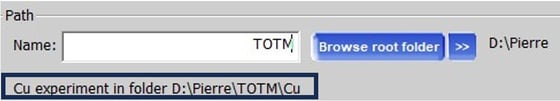
CrysAlisPro will create a subfolder with the name of the experiment and then additional subfolders for each wavelength.
9. At the bottom right, select Start Experiment.
Run a variable-temperature experiment
1. Select the multi-wavelength/temperature icon on the left column of icons:
2. Select the box to Use temperature device control and the type of your cryosystem. Then, open the Settings dialog.

3. Select Add to open the dialog for the data collection parameters per temperature setpoint.
In this dialog:
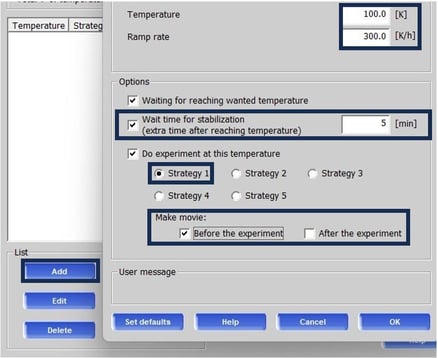
- Enter the desired temperature and ramp rate and select the boxes as shown below:
- Wait time for stabilization is the user-defined interval CrysAlisPro will wait before starting collection after the target temperature is reached. This ensures the cryo-system’s temperature is stable when the first image is collected.
- Select a strategy name (Strategy 1-5) for this temperature. This name will be linked to a specific strategy in the next step. If a different strategy is to be used at different temperatures, select a different strategy name for the corresponding temperatures.
- It is recommended to make a crystal movie at each temperature to keep track of crystal stability on the mount throughout the temperature range of the experiment. One can select to make a movie before and/or after data collection.
- Select OK when done.
4. Select Add again and enter the parameters for the next temperature setpoint.
- There is no limit on the number of setpoints
- Throughout the experiment, the temperature can be set to increase and decrease at will
- Different ramp rates, wait times and movie options may be selected for each setpoint.
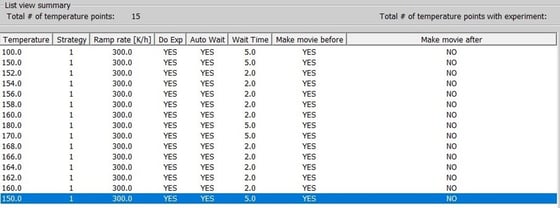
The example below shows a series of increasing and decreasing temperature changes with different intervals between and wait times between temperatures that could be used to study hysteresis in the behavior of a parameter in a crystal structure.
5. Select OK to return to the main dialog
6. Select the box near the wavelength(s) you are about to use. Remember to unselect the box for the unused wavelength if a single wavelength is to be used.
Note: if multiple wavelengths and multiple temperatures are combined, the same series of temperature settings must be used for all wavelengths.
7. For each Strategy 1-5 linked to a temperature setpoint in Steps 4 and 5, select the corresponding Strategy button.
8. Refer to Steps 4-6 of Run a multi-wavelength experiment to load each strategy.
9. Using File Explorer, browse to the *.run strategy file created upon running the pre-experiment.
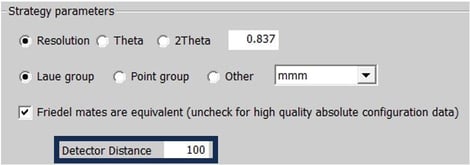
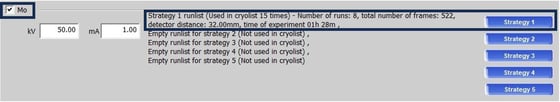
In the example below, the same Strategy 1 will be used for data collection with Mo radiation at 15 different temperatures. The parameters for Strategy 1 are also shown.
10. At the top of the dialog, select Browse root folder to select/create the project folder where the datasets will be saved and enter a name for the experiment.
CrysAlisPro will create a subfolder with the name of the experiment, then additional subfolders for each wavelength used, and a subfolder for each temperature setpoint.
12. At the bottom right, select Start Experiment.
Author
Rigaku Americas Coporation | Texas, USA
Dr. Pierre Le Maguerès obtained a Ph.D. in physical chemistry and small molecule crystallography at the University of Rennes (France) in 1995, working under Dr. Lahcene Ouahab on the synthesis and analysis of molecular materials combining inorganic polyoxometalates and organic cation radicals based on tetrathiofulvalene derivatives. From 1996 to 2000, Dr. Le Maguerès worked as a postdoctoral researcher with renowned Prof. Jay Kochi at the University of Houston, where he pursued his work on the synthesis and X-ray characterization of air-sensitive cation radicals and charge transfer complexes. In 2000, deciding to broaden his horizons and learn protein crystallography, Dr. Le Maguerès joined the biochemistry department at the University of Houston and worked as a postdoctoral researcher with Prof. Kurt Krause on the design and X-ray characterization of potential new inhibitors for alanine racemase, a protein essential for the growth of infectious diseases such as tuberculosis. Want to learn more? Connect with Pierre Le Magueres, PhD LinkedIn .
Subscribe to the Crystallography Times newsletter
Stay up to date with single crystal analysis news and upcoming events, learn about researchers in the field, new techniques and products, and explore helpful tips.

Contact Us
Whether you're interested in getting a quote, want a demo, need technical support, or simply have a question, we're here to help.