Applications
Density determination from total scattering data
It is well known that the density of a sample is calculated from the slope of G(r) in the region less than the nearest neighbor distance. The obtained G(r) is, however, often affected by non-physical modulation of the experimentally observed S(Q) and does not show a linear slope in the less-than-nearest-neighbor region; therefore, the estimated density has a large uncertainty. To overcome the problem, we have developed a Q -space iteration formula to remove such unphysical modulation of the experimentally observed S(Q) , without introducing any ambiguous parameters.
First, we demonstrate the determination of the density of SiO₂ glass from total scattering profile. Figure 18 shows the estimated density ρ0 of SiO₂ glass and the corresponding goodness of fit R for each iteration. The estimated atomic-number density converges to ρ₀ =0.06311 atoms⋅Å⁻³ as the number of iterations increases and the R value gradually decreases for each iteration step. Finally, we obtain the atomic-scale number density (ρ₀=0.06311 atoms⋅Å⁻³) of SiO₂ glass, which is consistent with the reported bulk density ¹, ²) ((ρbulk=0.06613 atoms⋅Å⁻³) ) within 5%.
/PDF%20applications%20fig18.jpg?width=703&height=294&name=PDF%20applications%20fig18.jpg) Figure 18: The estimated density and the corresponding goodness of fit R of SiO₂ glass for each iteration.
Figure 18: The estimated density and the corresponding goodness of fit R of SiO₂ glass for each iteration.
Next, we estimated the atomic number density of crystalline Ni by the same procedure. The determined Ni density ρ₀=0.09148 atoms⋅Å⁻³ is consistent with the bulk density ρbulk=0.09132 atoms⋅Å⁻³ calculated from the lattice parameter (space group: Fd3m, a=3.52503 Å), within 1% . Figure 19 shows the comparison between before and after density estimation of S(Q) and G(r) and they change little during the procedures.
/PDF%20Applications%20figure%2019.jpg?width=783&height=408&name=PDF%20Applications%20figure%2019.jpg) Figure 19: The comparison of (left) S(Q) and (right) associated G(r) of crystalline Ni before and after the determination density.
Figure 19: The comparison of (left) S(Q) and (right) associated G(r) of crystalline Ni before and after the determination density.
The proposed method can be applied to various samples where it is difficult to measure the density by Archimedes' principle (e.g., porous material, water-reactive substances). Please refer to this article¹ if you want more detailed information about atomic-number density determination of a sample from total scattering data.
References:
[1] M. Yoshimoto, K. Omote, J. Phys. Soc. Jpn. 91 (2022) 104602 (7pp). doi: 10.7566/JPSJ.91.104602
[2] M.Yoshimoto, Rigaku Journal 53 (2022) 27-36.
Local distortion analysis of LiMn₂O₄ LMO by the RMC method
The spinel LiMn₂O₄ (LMO) is a cathode material candidate and has a structural phase transition with a hysteresis between the heating and the cooling process¹,². In the high-temperature phase, LMO forms a cubic structure in space group Fd3m . There is a unique MnO₆ octahedron in cubic LMO. For the low-temperature phase, LMO forms an orthrhombic structure that is a 3a×3a×1a superstructure based on cubic LMO and MnO₆ octahedra are distorted and separated into five types. We will present an example of local structure analysis of LMOs with these unique features by the RMC method.
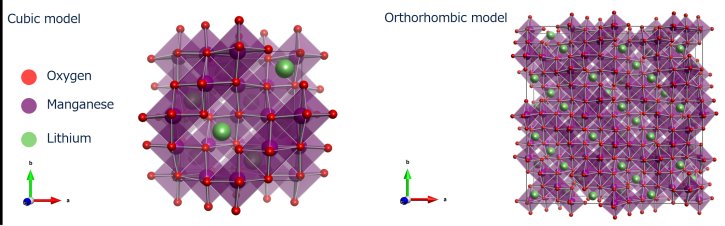 Figure 20: The structural model of LMO; (left) high-temperature phase (cubic model) and (right) low-temperature phase (orthorhombic model)
Figure 21 shows the comparison of S(Q) between calculated and observed. The bottom of Figure 21 also shows the corresponding residual curve. We have successfully constructed LMO structural models consistent with the experimental Sobs(Q) by RMC modeling.
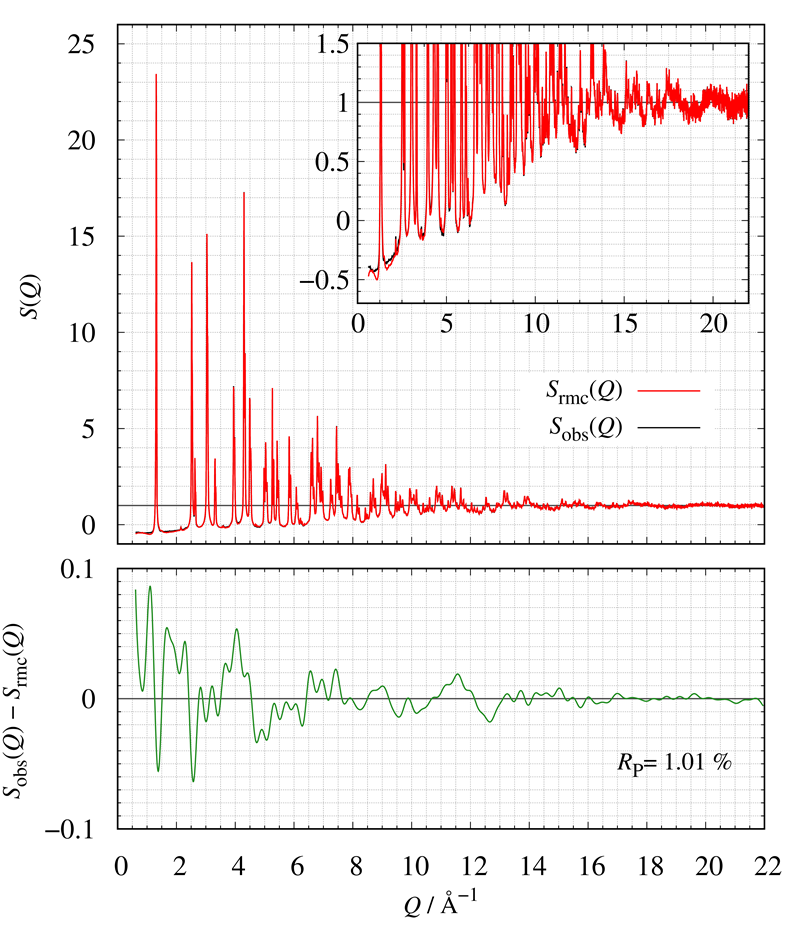 Figure 21: The comparison of S(Q); (red) calculated and (blue) obtained.
To evaluate the local structure of MnO₆ octahedra, the bond valence sum BVS method is applied to the structural model estimated by the RMC method to calculate the valence of each Mn site (BVS parameter: r₀=1.753 Å , R=0.37 Å ). Most Mn sites are classfied Mn³⁺: 58.98% and Mn⁴⁺: 34.96%. The correlation related to Mn²⁺ and Mn⁵⁺ are not used for detailed discussion of MnO₆ octahedra because those percentages (Mn²⁺: 5.95%, Mn⁵⁺: 0.097%) are low.
Figure 22 shows the O-(Mn)-O angular histogram of Mn³⁺ and Mn⁴⁺. The angular histogram of the ideal octahedron has two peaks at θ=90° and 180° but the simulated Mn³⁺ angular histogram (blue) shows a peak at less than θ=90° with wider distribution than that of Mn⁴⁺ (red). Please refer the articles³,⁴ if you want more information about this study and the RMC method.
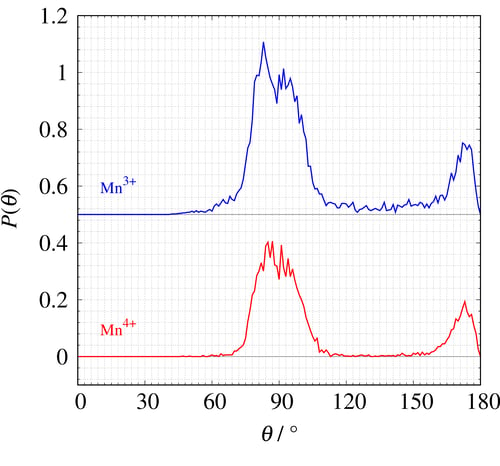 Figure 22: The O-(Mn)-O angular histogram of Mn³⁺ and Mn⁴⁺
The RMC method can provide local structural information in polycrystalline samples.
References:
[1] J. Rodríguez-Carvajal, G. Rousse, C. Masquelier, M. Hervieu, Phys. Rev. Lett. 81 (1998) 4660-4663. doi: 10.1103/PhysRevLett.81.4660
[2] G. Rousse, C. Masquelier, J. Rodríguez-Carvajal, E. Elkaim, J.-P. Lauriat, J.L. Martínez, Chem. Mater. 11 (1999) 3629-3635. doi: 10.1021/cm9910963
[3] M. Yoshimoto, K. Omote, Appl. Phys. Express 16 (2023) 015005 (4pp). doi: 10.35848/1882-0786/acb2b0
[4] M.Yoshimoto, Rigaku Journal, 53 (2022) 27-36.
Analysis of local structural changes during LI₃PS₄ crystallization
Li₃PS₄, a solid sulfide electrolyte, is widely known to show multiple phases such as glass α, β and γ phases. The characteristics of the three phases are shown in Figure 23.
/PDF%20Applications%20Figure%2022.jpg?width=750&height=405&name=PDF%20Applications%20Figure%2022.jpg) Figure 23: The crystal structure differences and phase transition temperatures for each phase¹
Figure 23: The crystal structure differences and phase transition temperatures for each phase¹
In this application, the total scattering measurement is performed through to R.T.~250℃ and the local structural changes during crystallization are visualized by the RMC method.
The following figure shows the comparison between the observed G(r) with crystallization and the weighted partial pair correlation wijGij(r) in the crystalline state (T = 250°C, t = 75.5 h). The shoulders and peaks at r ≥ 4.5 Å indicate P-S correlation and S-S correlation, respectively. Thus, the weighted partial correlations (i.e., wijGij(r)) can describe the profile changes in the observed G(r) with crystallization.
/PDF%20Applications%20Figure%2024.jpg?width=500&height=466&name=PDF%20Applications%20Figure%2024.jpg) Figure 24: The comparison between G(r) and wijGij(r)
Figure 24: The comparison between G(r) and wijGij(r)
top: G(r) of each measurement time, bottom: wijGij(r) of P-S, S-S, and S-Li
RMC refined atomic coordination collapsed into a gamma Li₃PS₄ unit cell of each state as shown in the figure below. As a general tendency, the average atomic distribution is narrow, with structural changes from glass to crystal. Furthermore, by analyzing more detail, it can be found that the average atomic distribution of high temperature glass becomes slightly broader than that of glass at room temperature.
The tendency of the analysis result on the atomic distribution in the unit cell is consistent with the Li ionic conductivity result with crystallization in previous study². This study shows that the libration of PS₄ anions plays an important role in Li ion migration in solid sulfide electrolytes.
/PDF%20Applications%20Figure%2025.jpg?width=750&height=310&name=PDF%20Applications%20Figure%2025.jpg) Figure 25: The distribution of each atom in the unit cell at each measurement temperature
Figure 25: The distribution of each atom in the unit cell at each measurement temperature
Full details of this application are published in Ref 3
References:
[1] K. Homma, M. Yonemura, T. Kobayashi, M. Nagao, M. Hirayama, R. Kanno, Solid State Ionics, 182 (2011) 53–58. doi: 10.1016/j.ssi.2010.10.001
[2] S. Shiotani, K. Ohara, H. Tsukasaki, S. Mori, R. Kanno, Sci. Rep. 7 (2017) 6972 (7pp). doi: 10.1038/s41598-017-07086-y
[3] M. Yoshimoto, T. Kimura, A. Sakuda, C. Hotehama, Y. Shiramata, A. Hayashi, K. Omote, Solid State Ionics, 401 (2023), 116361 (8pp). doi: 10.1016/j.ssi.2023.116361
Structural models drawn using VESTA, K. Momma and F. Izumi, J. Appl. Crystallogr. , 44 (2011) 1272-1276. doi:10.1107/S0021889811038970