Application Note PX026
Introduction
T. danielli thaumatin, a sweet-tasting protein often used as a sweetner, features an axis of ~150 Å. It is well characterised by protein crystallography and makes a good candidate for testing new equipment as it becomes available. Recently Rigaku Oxford Diffraction introduced a new detector: the HyPix-Arc 150°. The new detector provides extremely high theta coverage which can be used for fast collection of Friedel pairs. The detector features HPC technology for the highest accuracy of intensity measurement for both weak and strong signal ensuring that anomalous signal is well measured for S-SAD phasing applications. This note demonstrates fast S-SAD phasing of T. danielli thaumatin.
Experimental
T. daniellii thaumatin was purchased from Sigma and suspended in ultrapure, laboratory grade water to a concentration of 50 mg/ml. Crystals of thaumatin were grown at 18˚C from hanging drops consisting of 6 μL of 50 mg/ml thaumatin plus 4 μL of crystallization solution [24% (w/v) NaK Tartrate, 15% (v/v) ethylene glycol, and 0.1 M BisTris Propane, pH 6.6] over a well containing 500 μL of crystallization solution. Prior to flash-cooling, each crystal was soaked for ~15 to 30 seconds in the above crystallization solution at 25% (v/v) ethylene glycol for cryoprotection. A crystal was then selected and stored in a dry shipper prior to data collection.
Table 1: XtaLAB Synergy-DW with HyPix-Arc 150° key features
| X-ray source
|
Type | PhotonJet-DW dual wavelength rotating anode |
| Power | 1.2 kW | |
| Divergence control | Continuously variable slit | |
| Goniometer
|
Type | 4-circle Kappa goniometer |
| XTD range | 30-250 mm | |
| Detector
|
Type | HyPix-Arc 150° hybrid photon counting detector |
| Pixel size | 100 µm |
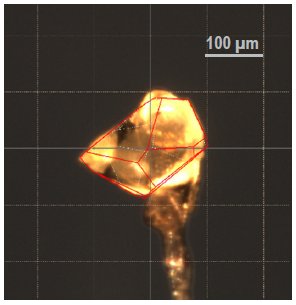
Figure 1: Thaumatin crystal used.
The data were collected on a XtaLAB Synergy-DW dual wavelength rotating anode diffractometer equipped with the curved HyPix-Arc 150° detector. A crystal measuring 0.13 x 0.15 x 0.27 mm was selected and screened with CrysAlisPro to determine it had a suitable diffraction limit. Using CrysAlisPro a Cu strategy was planned that aimed to get suitable data for structure solution using S-SAD phasing in under 10 minutes. Due to the superior spatial resolution of the 100 µm pixels with no point spread, it was possible to collect the data at a crystal to detector distance of 60 mm while still resolving the long axis. The strategy module was also set to align the crystal for best orientation of the long axis on the detector. The data that were collected were processed in CrysAlisPro with a 1.45 Å resolution limit and passed on to AIMLESS for merging. The Phaser-EP pipeline in the CCP4 suite was used to solve the structure. PARROT and BUCCANEER were then used for density modification and model building respectively and COOT was used for model correction.
Results
The sample diffracted extremely well and for the chosen scan speed of 1.5 seconds per degree (0.3 s per 0.2° image), a diffraction limit of 1.45 Å was determined. The unit cell was found by CrysAlisPro to be tetragonal P with a = b = 57.81 Å, c = 149.95 Å and the cell was found automatically with no user intervention required.
Divergence slits were fully open throughout the experiment and despite this, the long axis was well resolved at an XTD of 60 mm as can be seen in figure 2.
Table 2: Dataset statistics
| Space group | P4₁2₁2 |
| Unit cell (Å) | 57.81, 57.81, 149.95 |
| Total time | 9m 53s |
| Resolution (Å) [last shell] | 22.96 - 1.45 [1.48 - 1.45] |
| Total / unique reflections | 699245 / 45973 |
| Completeness [last shell] | 99.7 [94.3] |
| Multiplicity [last shell] | 15.2 [3.3] |
| <I/σ(I)> [last shell] | 23.1 [1.4] |
| Rmerge (%) [last shell] | 7.5 [69.6] |
| CC½ [last shell] | 0.999 [0.571] |
| R1 / Rfree (%) | 12.0 / 16.0 |

Figure 2: Peaks along the long 150 Å axis are well resolved at 60 mm
This excellent spatial resolution can be attributed to the 100 µm pixel size and the single-pixel top-hat point spread function.
After processing with CrysAlisPro and merging with AIMLESS an Rmerge of 7.5% was obtained to 1.45 Å. Solution with the Phaser pipeline in CCP4 gave 24 initial sites from which the full model was easily built with automated building routines in Buccaneer. Following iterative cycles of refinement, and model correction with COOT, the final model produced R1 = 12.0% and Rfree = 16.0%.

Figure 3: Nicely defined electron density map following S-SAD phasing from a 10 minute thaumatin dataset
Conclusion
The crystal structure of T. daniellii thaumatin was easily solved by S-SAD phasing to 1.45 Å. The extremely high data quality provided by the HyPix-Arc 150° and XtaLAB Synergy-DW diffractometer allowed this to be achieved with only 10 minutes of data collection time.
