Application Note WDXRF1104
Introduction
Residual oil, which contains S, Fe, Ni, V and other elements, is obtained after distilling crude oil. It is used for marine fuel or electric power plant fuel. When residual oil is burned, some elements can cause damage to marine engines and the environment. For example, sulfur is considered the most harmful element causing air pollution, and metals like Ni, V and Fe are regarded as catalyst poisons, blocking a catalyst’s performance.
XRF is a powerful tool for analyzing these elements in residual oil. Sample preparation is very simple and analysis results are obtained quickly.
This application note demonstrates that ZSX Primus IVi is compliant with IP610/13 for the analysis of S, Fe, Ni and V.
Instrument
The ZSX Primus IVi, a tube-below sequential wavelength dispersive X-ray fluorescence (WDXRF) spectrometer, is optimized for the routine analyses that today’s petroleum laboratories need to perform. The optical chamber can be maintained under vacuum while the sample chamber is under helium atmosphere by using a vacuum seal between the optical chamber and the sample chamber. The vacuum seal minimizes helium gas consumption and reduces the time required for helium purge. The spectrometer is equipped with a 4 kW X-ray tube with an ultra-thin beryllium window or a 3 kW X-ray tube.
The operation software is designed for easy routine analysis. The quantitative analysis flowbar guides users step by step to generate applications. The sample ID table and program operation help operators carry out daily analysis.
Sample and sample preparation
Residual oil standard samples supplied by Analytical Services, Inc. were used for calibration.
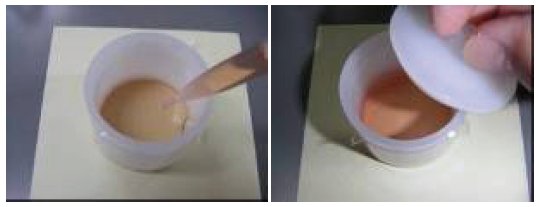
Eight grams of each residual oil sample was poured into a liquid cell (Chemplex® 1095). 3.6 μm thick Mylar® (Chemplex® 150) was used as the sample film.

Figure 1: Oil sample cell
Measurement and calibration
Measurements were performed on the ZSX Primus IVi with a high performance 4 kW Rh-target X-ray tube for S, Fe, Ni and V. Primary beam filters were used to protect the X-ray tube window in case of sample leakage. In addition, the filter reduces the background to improve the peak-to-background ratio. Measurement conditions are shown in Table 1.
Table 1: Measurement conditions
| Element | S | Fe | Ni | V |
| Line | Kα | Kα | Kα | Kα |
| kV-mA | 50-50 | 50-50 | 50-50 | 50-50 |
| Primary filter | Be30 | Al125 | Al125 | Al25 |
| Slit | S4 | S2 | S2 | S2 |
| Crystal | GeH | LiF | LiF | LiF |
| Detector | PC | SC | SC | SC |
| Time Peak(s) | 20 | 20 | 20 | 20 |
| BG(s) | 10x2 | 10x2 | 10x2 | 10x2 |
Note) LiF: LiF(200), PC: F-PC
The calibration curves were generated with a matrix correction applied to all the analytes. The correction coefficients used were calculated theoretically by the fundamental parameter (FP) method. The calibration results are listed in Table 2 and the calibration curves are shown in Figure 2.
Table 2: Calibration results
| Element | unit | Calibration range | Accuracy |
| S | mass% | 0.165 – 5.51 | 0.014 |
| Fe | ppm | 13 – 504 | 8.1 |
| Ni | ppm | 2 – 101 | 1.0 |
| V | ppm | 2 – 150 | 5.8 |

Figure 2: Calibration curves for residual oil
The accuracy of linear calibration is calculated by the following formula:
$Accuracy = \sqrt{ \frac{\sum_i{(C_i-\hat{C}_i)^2}}{n-2} }$
$C_i$: calculated value of standard sample
$\hat{C}_i$: reference value of standard sample
n : number of standard samples.
Analysis results
Typical lower limits of detection (LLD) for Fe, Ni and V calculated using the standard sample with the lowest content by the following formula are shown in Table 3.
$LLD = 3 \cdot \frac{x}{I_S} \cdot \sqrt{\frac{2 \cdot I_{BG}}{1000 \cdot t}}$
$x$: Standard value (ppm)
$t$: Counting time for the peak (s)
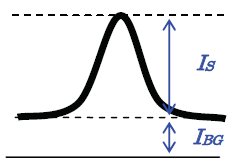
$I_S$: Net intensity (kcps)
$I_{BG}$ : Background intensity (kcps)

Figure 3: Net and background intensities
Table 3: LLDs of Fe, Ni and V (t = 100 s) (unit: ppm)
| Element | LLD |
| Fe | 0.2 |
| Ni | 0.1 |
| V | 0.5 |
Repeatability tests for two samples (sample A and B) were carried out for 21 test portions according to “method A” of IP610-13. The test results are tabulated in Table 4, in which the differences between two successive aliquots are shown and “r” represents “repeatability” as defined in IP 610/13, which states that the difference between two successive test results obtained by the same operator with the same apparatus under constant operation conditions on identical test material would, in the normal and correct operation of the test method, exceed the value in Table 5, which lists the repeatability (r) of each analyte, in only one case in twenty.
The test results shown in Table 4, where the difference between two successive aliquots does not exceed the repeatability (r) for each analyte, prove that the performance of the ZSX Primus IVi meets the requirement of ISO610-13 for S, Fe, Ni and V analysis.
Table 4: Repeatability test results
(A) Sample A
| S* | Fe | Ni | V | |||||
| mass% | ppm | ppm | ppm | |||||
| Result | Diff. | Result | Diff. | Result | Diff. | Result | Diff. | |
| 1 | 0.170 | 12.9 | 49.3 | 259.8 | ||||
| 2 | 0.169 | 0.000 | 14.5 | 1.6 | 49.8 | 0.5 | 257.2 | 2.5 |
| 3 | 0.169 | 0.000 | 14.5 | 0.0 | 49.4 | 0.4 | 258.7 | 1.5 |
| 4 | 0.170 | 0.001 | 13.5 | 1.0 | 49.5 | 0.1 | 260.4 | 1.7 |
| 5 | 0.171 | 0.001 | 12.7 | 0.8 | 49.0 | 0.5 | 259.2 | 1.2 |
| 6 | 0.170 | 0.001 | 13.8 | 1.1 | 49.5 | 0.5 | 260.5 | 1.3 |
| 7 | 0.170 | 0.001 | 13.8 | 0.1 | 49.7 | 0.2 | 261.5 | 1.0 |
| 8 | 0.170 | 0.000 | 13.6 | 0.2 | 49.4 | 0.3 | 258.5 | 3.0 |
| 9 | 0.170 | 0.000 | 14.0 | 0.4 | 49.4 | 0.0 | 259.2 | 0.7 |
| 10 | 0.170 | 0.001 | 13.6 | 0.4 | 49.8 | 0.5 | 262.0 | 2.8 |
| 11 | 0.172 | 0.002 | 13.5 | 0.1 | 50.1 | 0.3 | 259.2 | 2.9 |
| 12 | 0.171 | 0.001 | 13.4 | 0.1 | 50.1 | 0.0 | 261.9 | 2.7 |
| 13 | 0.170 | 0.001 | 13.7 | 0.3 | 50.0 | 0.1 | 261.9 | 0.0 |
| 14 | 0.170 | 0.000 | 13.0 | 0.7 | 49.8 | 0.2 | 257.7 | 4.2 |
| 15 | 0.171 | 0.001 | 13.9 | 0.9 | 49.9 | 0.1 | 259.6 | 1.9 |
| 16 | 0.171 | 0.000 | 12.6 | 1.2 | 49.6 | 0.2 | 258.9 | 0.6 |
| 17 | 0.171 | 0.000 | 13.8 | 1.1 | 50.6 | 0.9 | 261.2 | 2.3 |
| 18 | 0.170 | 0.001 | 14.1 | 0.3 | 49.8 | 0.8 | 263.3 | 2.0 |
| 19 | 0.171 | 0.001 | 13.8 | 0.3 | 50.2 | 0.4 | 262.4 | 0.8 |
| 20 | 0.170 | 0.001 | 13.9 | 0.0 | 50.1 | 0.1 | 260.5 | 1.9 |
| 21 | 0.170 | 0.001 | 13.6 | 0.3 | 50.0 | 0.1 | 259.8 | 0.8 |
| Max. | 0.002 | 1.6 | 0.9 | 4.2 | ||||
| r | 0.028 | 5.1 | 2.3 | 9.3 | ||||
(B) Sample B
| S | Fe | Ni | V | |||||
| mass% | ppm | ppm | ppm | |||||
| Result | Diff. | Result | Diff. | Result | Diff. | Result | Diff. | |
| 1 | 2.01 | 203.6 | 39.5 | 117.9 | ||||
| 2 | 2.02 | 0.00 | 206.7 | 3.1 | 39.9 | 0.4 | 119.1 | 1.2 |
| 3 | 2.01 | 0.01 | 207.3 | 0.7 | 39.6 | 0.3 | 118.4 | 0.7 |
| 4 | 2.03 | 0.02 | 206.9 | 0.5 | 39.4 | 0.1 | 118.0 | 0.3 |
| 5 | 2.00 | 0.03 | 207.5 | 0.6 | 39.2 | 0.3 | 118.0 | 0.0 |
| 6 | 1.99 | 0.01 | 204.1 | 3.4 | 39.3 | 0.1 | 115.8 | 2.2 |
| 7 | 2.01 | 0.02 | 206.0 | 1.9 | 39.6 | 0.4 | 118.4 | 2.6 |
| 8 | 2.00 | 0.01 | 206.9 | 0.9 | 39.6 | 0.0 | 118.3 | 0.2 |
| 9 | 2.00 | 0.01 | 206.5 | 0.4 | 39.6 | 0.1 | 116.4 | 1.9 |
| 10 | 1.98 | 0.02 | 207.2 | 0.7 | 39.2 | 0.4 | 116.8 | 0.4 |
| 11 | 1.99 | 0.01 | 203.4 | 3.8 | 39.2 | 0.1 | 118.0 | 1.2 |
| 12 | 2.00 | 0.01 | 207.6 | 4.3 | 39.7 | 0.4 | 116.7 | 1.3 |
| 13 | 2.00 | 0.00 | 207.1 | 0.5 | 39.6 | 0.1 | 117.2 | 0.6 |
| 14 | 1.99 | 0.01 | 205.0 | 2.1 | 39.6 | 0.0 | 117.7 | 0.5 |
| 15 | 1.99 | 0.00 | 206.1 | 1.1 | 40.0 | 0.4 | 117.9 | 0.2 |
| 16 | 1.99 | 0.00 | 205.0 | 1.1 | 40.0 | 0.0 | 117.9 | 0.0 |
| 17 | 1.99 | 0.00 | 205.6 | 0.6 | 39.7 | 0.3 | 117.1 | 0.7 |
| 18 | 1.98 | 0.01 | 204.4 | 1.3 | 39.2 | 0.5 | 117.3 | 0.1 |
| 19 | 1.98 | 0.01 | 206.4 | 2.0 | 39.9 | 0.7 | 119.3 | 2.0 |
| 20 | 1.99 | 0.00 | 206.7 | 0.3 | 39.8 | 0.1 | 117.5 | 1.8 |
| 21 | 1.99 | 0.00 | 206.2 | 0.5 | 39.7 | 0.1 | 118.5 | 1.0 |
| Max. | 0.03 | 4.3 | 0.7 | 2.6 | ||||
| r | 0.33 | 23.5 | 1.9 | 4.4 | ||||
Table 5: Repeatability defined in IP 610/13 METHOD A
| Element | Concentration range | Repeatability [ r ] |
| S | 0.9274 mass% – 3.4015 mass% | 0.1632 X |
| Fe | 8.5 ppm – 243.7 ppm | 0.09563 (X+40) |
| Ni | 2.3 ppm – 86.3 ppm | 0.03231 (X+20) |
| V | 12.4 ppm – 363.9 ppm | 0.03455 (X+10) |
Conclusions
Routine analysis of residual oil with high accuracy and precision can be easily performed on the ZSX Primus IVi. This application note demonstrates that the performance of the ZSX Primus IVi meets the requirements of IP 610/13 for the analysis of S, Fe, Ni and V.
Reference
IP 610/13; Determination of sulfur, vanadium, nickel, iron, calcium, zinc and phosphorous in residual fuel oil by wavelength dispersive X-ray fluorescence spectrometry.

