Application Note EDXRF3268
Scope
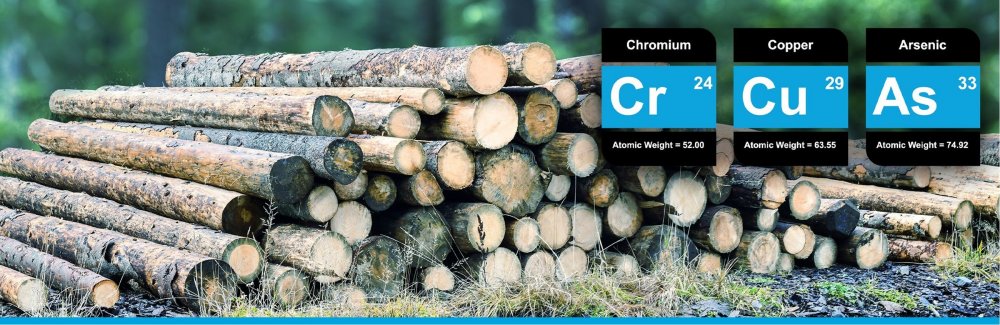
This application note demonstrates the measurement of CCA (chromium oxide, copper oxide, and arsenic oxide) in treated wood and wood treatment solutions using the Rigaku NEX QC II energy dispersive X-ray fluorescence (EDXRF) analyzer
Background
Wood treatments are used to protect lumber from fungi, insects, UV damage, and general wear. In recent years, the U.S. Environmental Protection Agency (EPA) has requested voluntary restrictions on the use of chromated copper arsenate (CCA) wood treatments due to concerns about chromium and arsenic leaching into soil. Today, CCA-treated lumber is primarily used in a limited number of situations, such as in roofing shingles, permanent building foundations, and certain commercial applications. When treating wood, the proper balance of the treatment solution must be monitored to maintain consistent product quality while minimizing preservative consumption, reducing operating costs, and preventing product rejection. Chromium, copper, and arsenic levels are monitored in the treatment solution prior to treatment and then in the finished wood to verify proper retention. A fast, simple, and reliable analytical method is required throughout the quality control process. EDXRF provides an ideal solution for this analysis
Calibration – CCA in wood
An empirical calibration was built using a set of assayed wood standards.
| Element: Cr2O3 Units: % |
||
| Sample I.D. | Standard value | Calculated value |
| 1 | 0.360 | 0.349 |
| 2 | 0.517 | 0.534 |
| 3 | 0.681 | 0.682 |
| 4 | 0.810 | 0.799 |
| 5 | 0.873 | 0.857 |
| 6 | 1.087 | 1.090 |
| 7 | 1.329 | 1.379 |
| 8 | 2.096 | 2.052 |
| 9 | 2.953 | 2.962 |
| 10 | 3.885 | 3.887 |
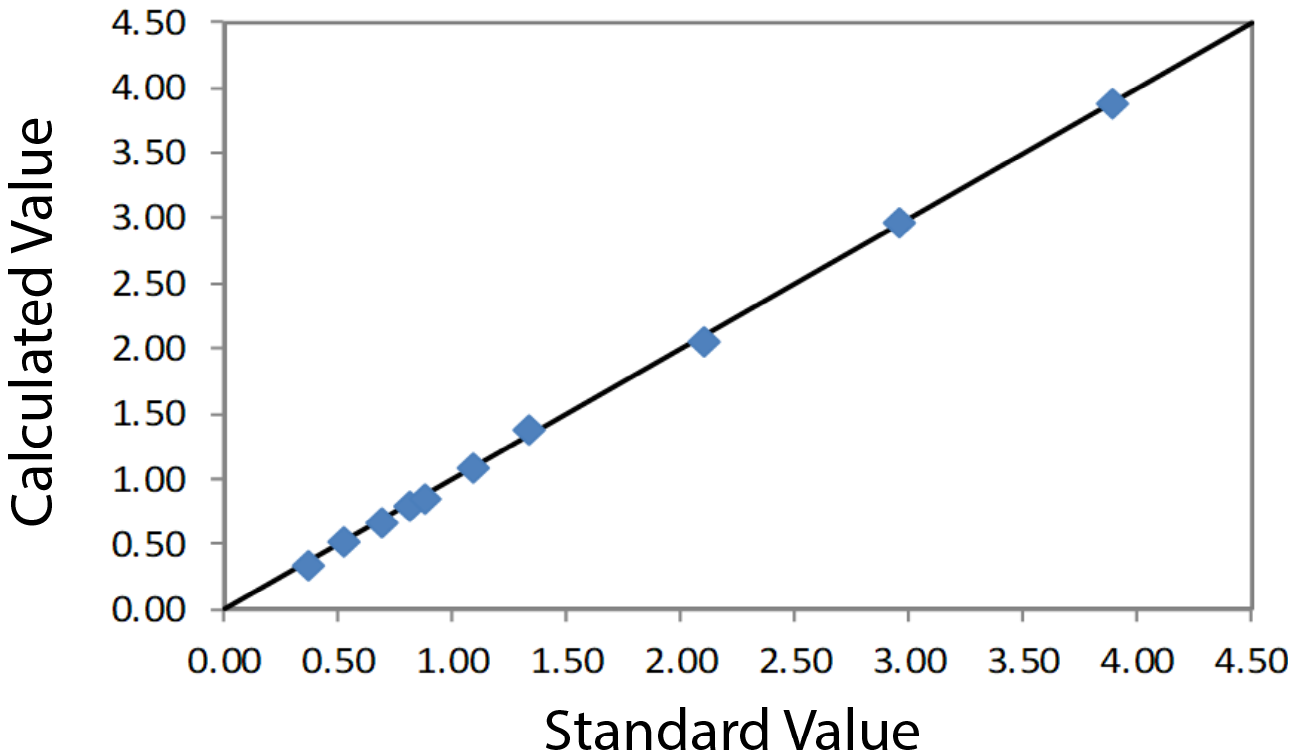
Calibration plot Cr2O3 in wood
| Element: CuO Units: % |
||
| Sample I.D. | Standard value | Calculated value |
| 1 | 0.134 | 0.124 |
| 2 | 0.187 | 0.199 |
| 3 | 0.245 | 0.244 |
| 4 | 0.289 | 0.289 |
| 5 | 0.309 | 0.315 |
| 6 | 0.383 | 0.393 |
| 7 | 0.472 | 0.457 |
| 8 | 0.732 | 0.717 |
| 9 | 1.037 | 1.054 |
| 10 | 1.377 | 1.372 |
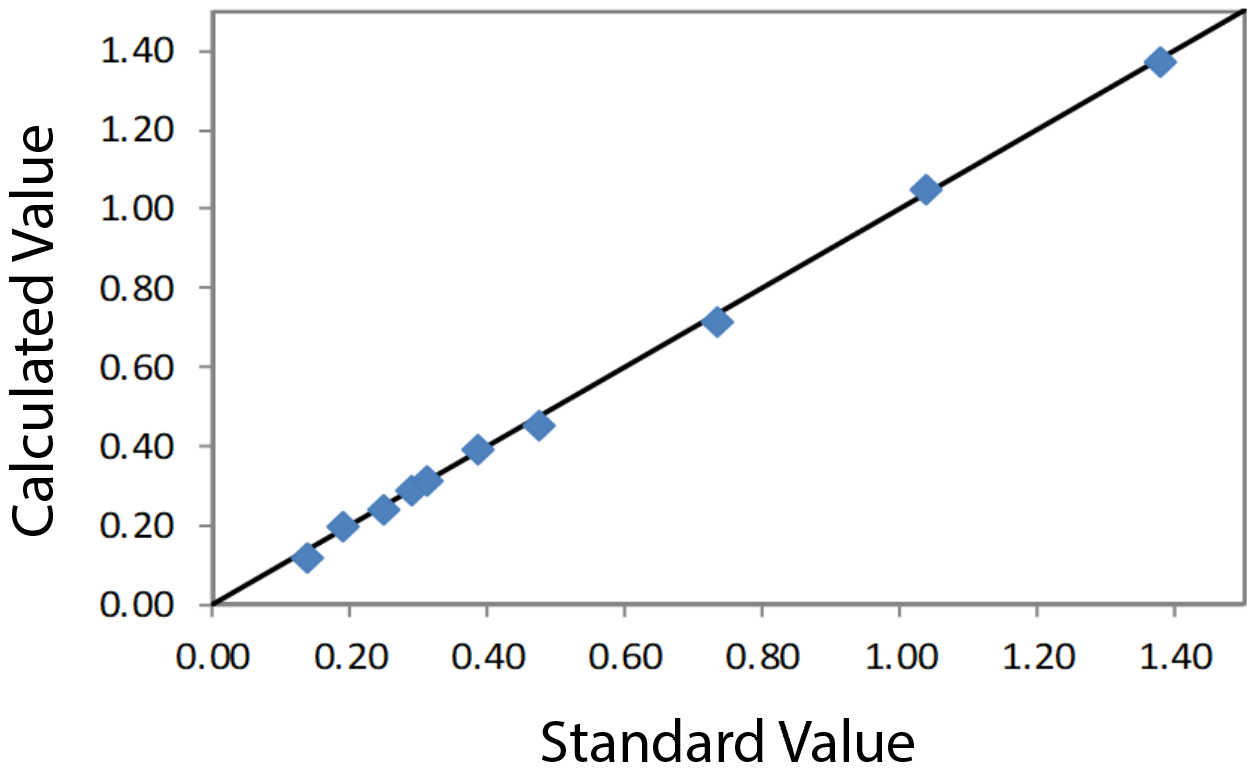
Calibration plot CuO in wood
| Element: As₂O₅ Units: % |
||
| Sample I.D. | Standard Value | Calculated Value |
| 1 | 0.252 | 0.224 |
| 2 | 0.359 | 0.380 |
| 3 | 0.477 | 0.482 |
| 4 | 0.566 | 0.576 |
| 5 | 0.612 | 0.625 |
| 6 | 0.761 | 0.790 |
| 7 | 0.936 | 0.887 |
| 8 | 1.485 | 1.491 |
| 9 | 2.189 | 2.166 |
| 10 | 2.792 | 2.809 |
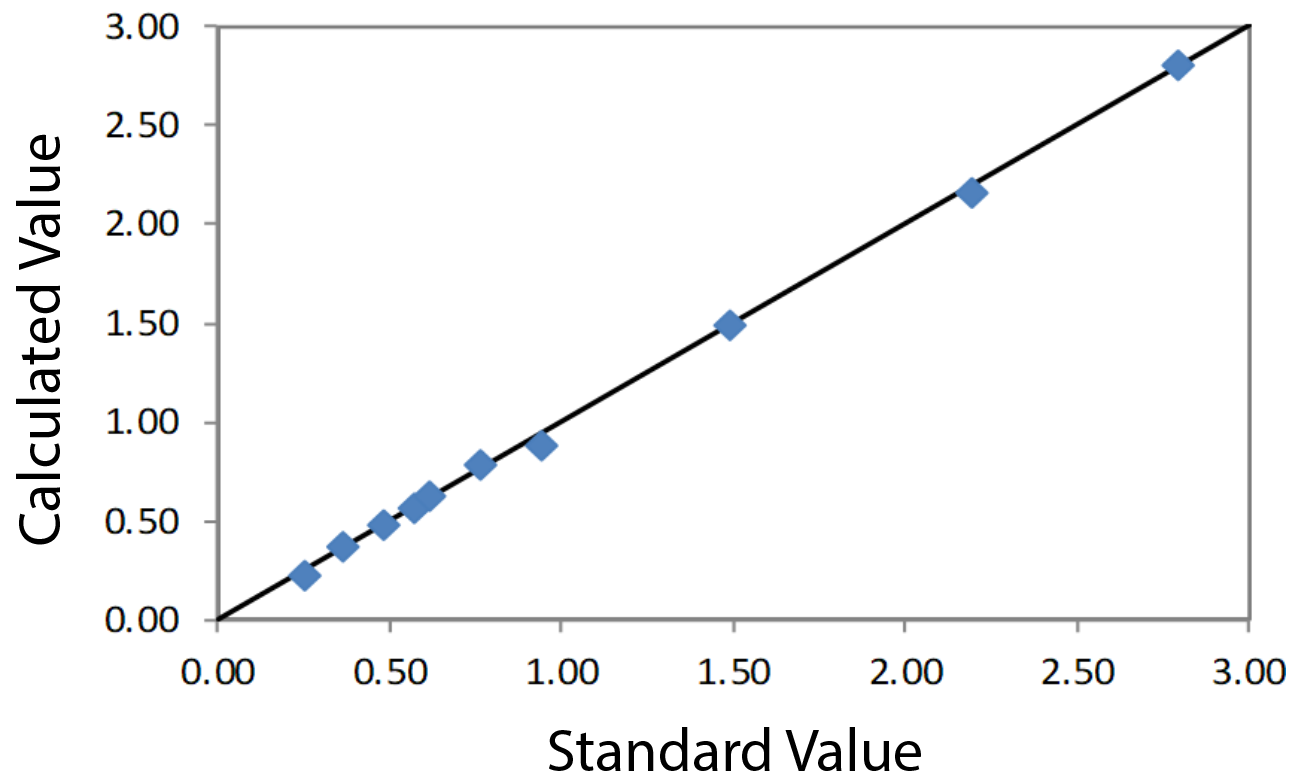
Calibration plot As₂O₅ in wood
Repeatability – CCA in wood
To demonstrate repeatability (precision), the low and high samples were chosen from the set of calibration standards. Each sample was measured in static position.
| Element: Cr₂O₃ Units: % |
||||
| Sample I.D. | Standard Value | Average Value | Std. Dev | % Relative |
| 1 | 0.360 | 0.3489 | 0.0019 | 0.5 |
| 10 | 3.885 | 3.8938 | 0.0093 | 0.2 |
| Element: CuO Units: % |
||||
| Sample I.D. | Standard Value | Average Value | Std. Dev | % Relative |
| 1 | 0.134 | 0.1237 | 0.0004 | 0.2 |
| 10 | 1.377 | 1.3746 | 0.0013 | 0.1 |
| Element: As₂O₅ Units: % |
||||
| Sample I.D. | Standard Value | Average Value | Std. Dev | % Relative |
| 1 | 0.252 | 0.2435 | 0.0004 | 0.2 |
| 10 | 2.792 | 2.8014 | 0.0030 | 0.1 |
Calibration – CCA in solution low range
An empirical calibration was built using a set of assayed wood standards.
| Element: Cr2O3 Units: % |
||
| Sample I.D. | Assay value | Calculated value |
| 1 | 0.258 | 0.268 |
| 2 | 0.425 | 0.416 |
| 3 | 0.566 | 0.558 |
| 4 | 0.717 | 0.720 |
| 5 | 0.846 | 0.841 |
| 6 | 0.986 | 0.996 |
| 7 | 1.129 | 1.129 |
| 8 | 1.270 | 1.275 |
| 9 | 1.412 | 1.406 |
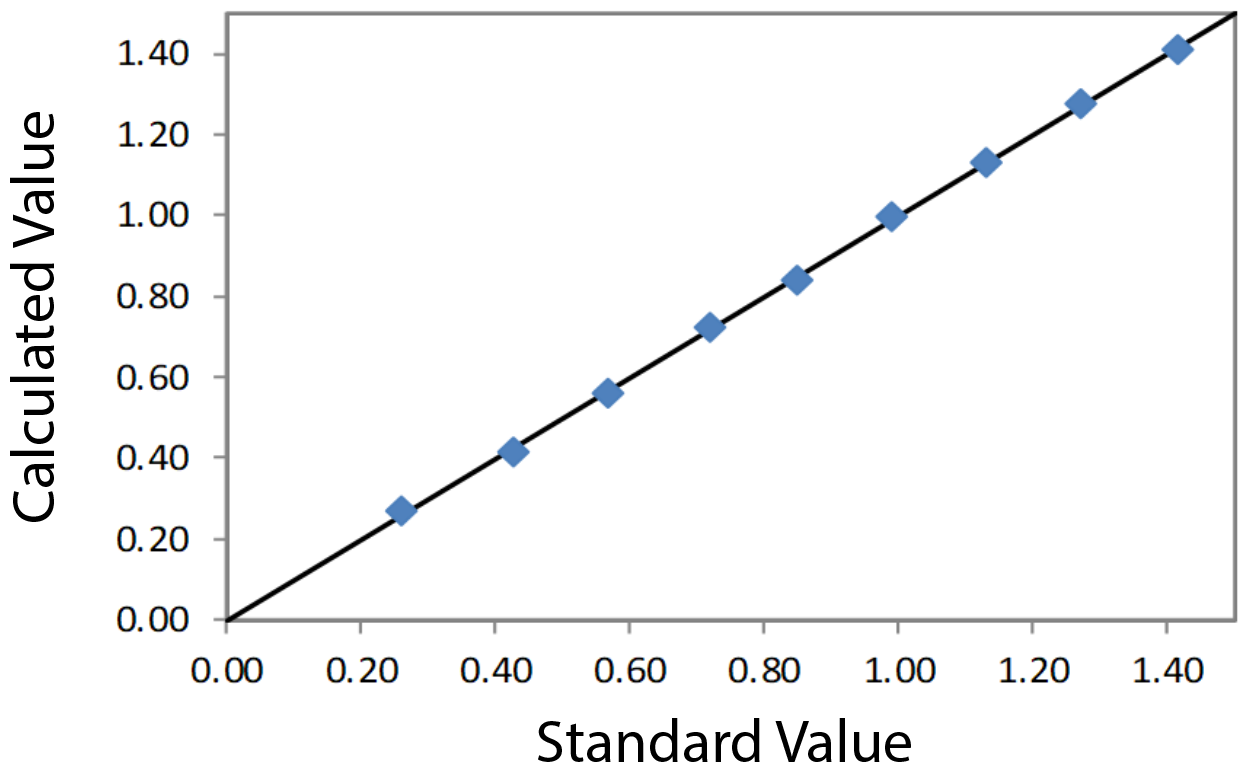
Calibration plot Cr2O3 in solution
| Element: CuO Units: % |
||
| Sample I.D. | Assay value | Calculated value |
| 1 | 0.109 | 0.110 |
| 2 | 0.163 | 0.163 |
| 3 | 0.217 | 0.216 |
| 4 | 0.275 | 0.275 |
| 5 | 0.324 | 0.323 |
| 6 | 0.378 | 0.381 |
| 7 | 0.432 | 0.431 |
| 8 | 0.486 | 0.486 |
| 9 | 0.541 | 0.541 |
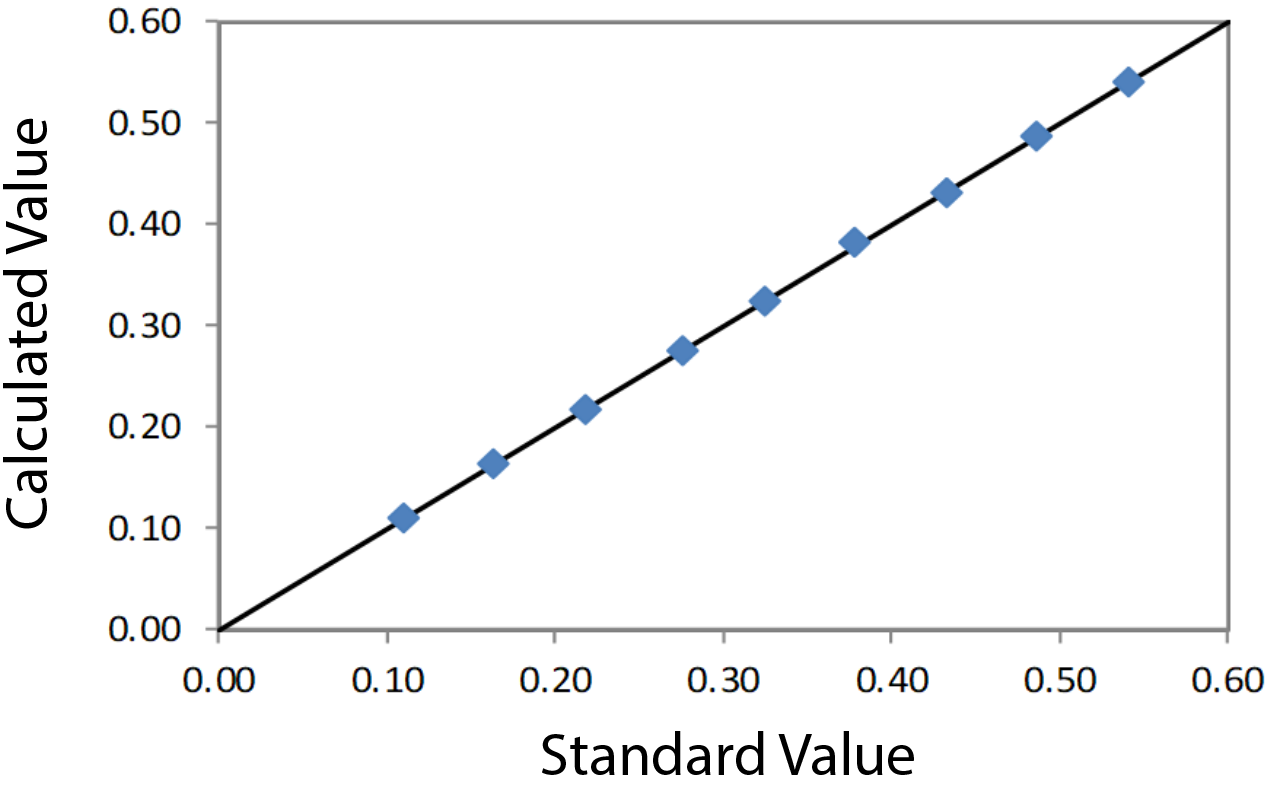
Calibration plot CuO in solution
| Element: As₂O₅ Units: % |
||
| Sample I.D. | Assay value | Calculated value |
| 1 | 0.212 | 0.212 |
| 2 | 0.317 | 0.319 |
| 3 | 0.422 | 0.421 |
| 4 | 0.543 | 0.537 |
| 5 | 0.630 | 0.629 |
| 6 | 0.734 | 0.742 |
| 7 | 0.841 | 0.838 |
| 8 | 0.946 | 0.948 |
| 9 | 1.052 | 1.050 |
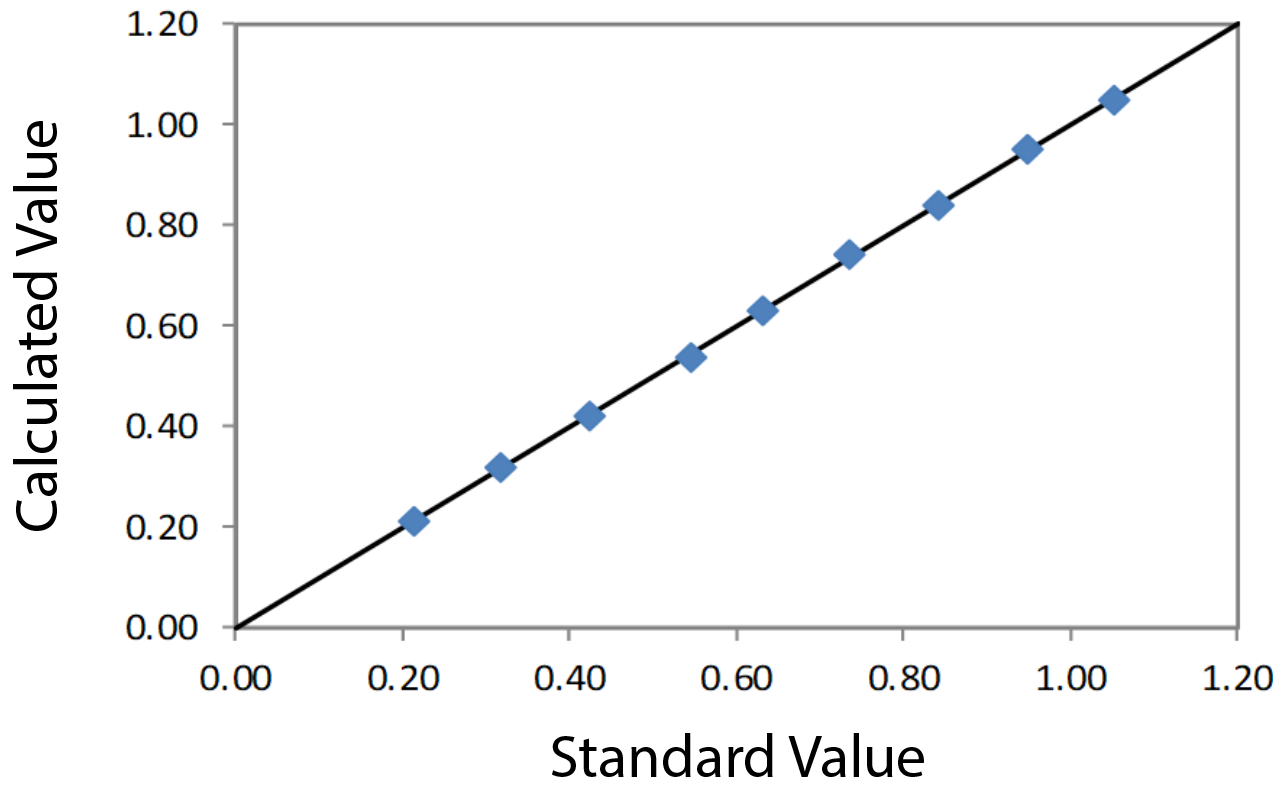
Calibration plot As₂O₅ in solution
Repeatability – CCA in solution low range
To demonstrate repeatability (precision), the low and high samples were chosen from the set of calibration standards. Each sample was measured in static position.
| Element: Cr₂O₃ Units: % |
||||
| Sample I.D. | Standard value | Average value | Std. dev | % Relative |
| 1 | 0.258 | 0.2634 | 0.0019 | 0.7 |
| 9 | 1.412 | 1.4154 | 0.0067 | 0.5 |
| Element: CuO Units: % |
||||
| Sample I.D. | Standard value | Average value | Std. dev | % Relative |
| 1 | 0.109 | 0.1099 | 0.0004 | 0.4 |
| 9 | 0.541 | 0.5445 | 0.0011 | 0.2 |
| Element: As₂O₅ Units: % |
||||
| Sample I.D. | Standard value | Average value | Std. dev | % Relative |
| 1 | 0.212 | 0.2130 | 0.0003 | 0.1 |
| 9 | 1.052 | 1.0576 | 0.0008 | 0.1 |
Calibration – CCA in solution high range
An empirical calibration was built using a set of assayed wood standards.
| Element: Cr2O3 Units: % |
||
| Sample I.D. | Assay value | Calculated value |
| 1 | 0.735 | 0.738 |
| 2 | 1.224 | 1.219 |
| 3 | 1.470 | 1.477 |
| 4 | 1.959 | 1.951 |
| 5 | 2.448 | 2.447 |
| 6 | 2.938 | 2.941 |
| 7 | 3.427 | 3.434 |
| 8 | 3.911 | 3.906 |
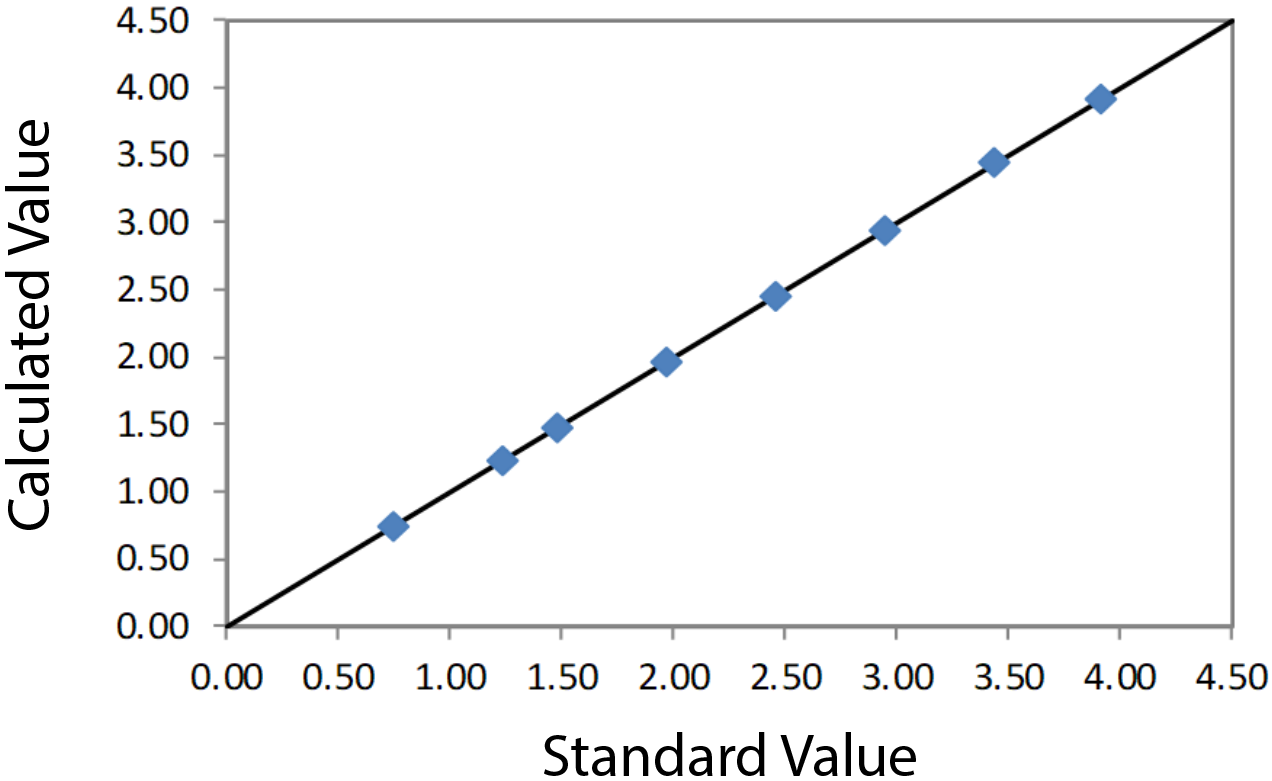
Calibration plot Cr2O3 in solution
| Element: CuO Units: % |
||
| Sample I.D. | Assay value | Calculated value |
| 1 | 0.264 | 0.265 |
| 2 | 0.439 | 0.439 |
| 3 | 0.527 | 0.525 |
| 4 | 0.702 | 0.700 |
| 5 | 0.878 | 0.881 |
| 6 | 1.053 | 1.055 |
| 7 | 1.228 | 1.227 |
| 8 | 1.402 | 1.401 |
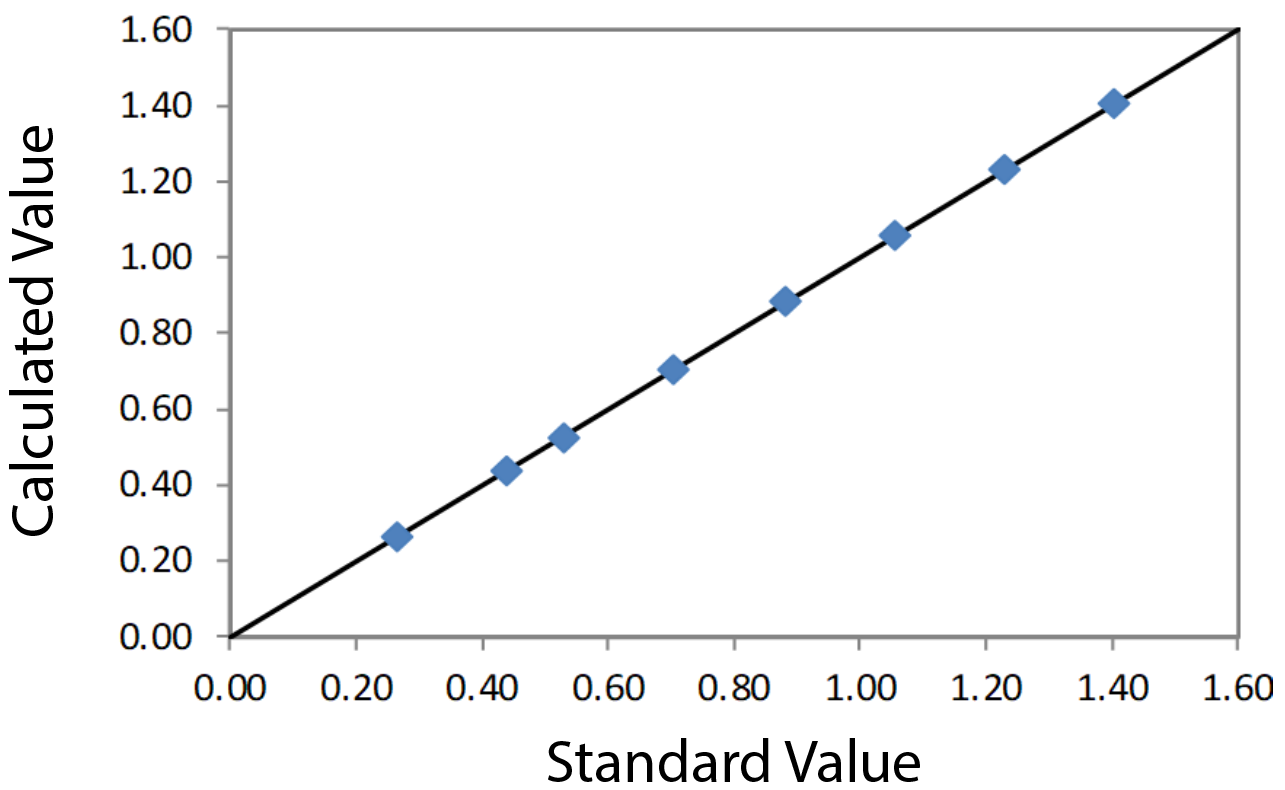
Calibration plot CuO in solution
| Element: As₂O₅ Units: % |
||
| Sample I.D. | Assay value | Calculated value |
| 1 | 0.550 | 0.553 |
| 2 | 0.915 | 0.914 |
| 3 | 0.915 | 1.094 |
| 4 | 1.464 | 1.456 |
| 5 | 1.830 | 1.837 |
| 6 | 2.197 | 2.207 |
| 7 | 2.562 | 2.566 |
| 8 | 2.924 | 2.914 |
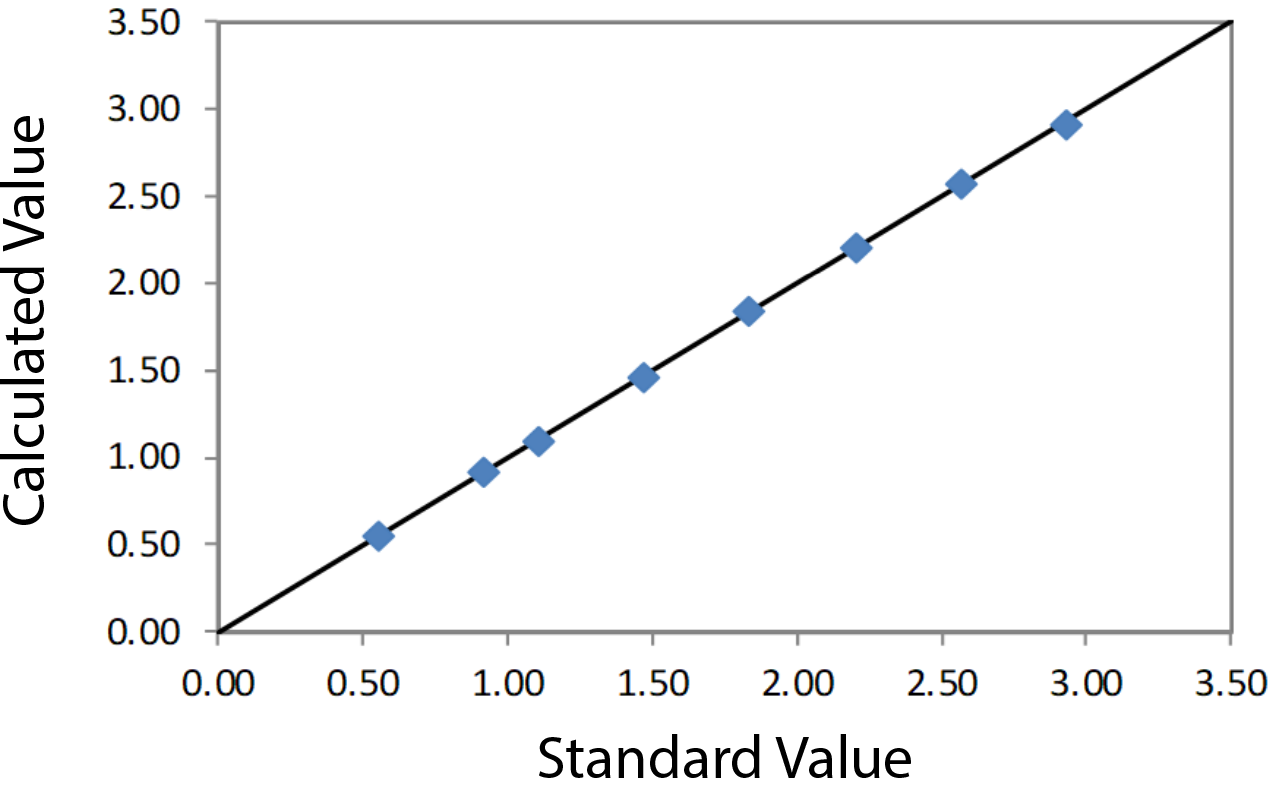
Calibration plot As₂O₅ in solution
Repeatability – CCA in solution high range
To demonstrate repeatability (precision), the low and high samples were chosen from the set of calibration standards. Each sample was measured in static position.
| Element: Cr₂O₃ Units: % |
||||
| Sample I.D. | Standard value | Average value | Std. dev | % Relative |
| 1 | 0.735 | 0.7367 | 0.0031 | 0.4 |
| 8 | 3.911 | 3.9220 | 0.0077 | 0.2 |
| Element: CuO Units: % |
||||
| Sample I.D. | Standard value | Average value | Std. dev | % Relative |
| 1 | 0.264 | 0.2659 | 0.0004 | 0.2 |
| 8 | 1.402 | 1.4017 | 0.0037 | 0.3 |
| Element: As₂O₅ Units: % |
||||
| Sample I.D. | Standard value | Average value | Std. dev | % Relative |
| 1 | 0.550 | 0.5555 | 0.0007 | 0.1 |
| 8 | 2.924 | 2.9377 | 0.0037 | 0.1 |
Conclusion
The results detailed here show the Rigaku NEX QC II’s ability to provide fast, simple, and reliable measurement of CCA in treated wood and wood treatment solutions. The Rigaku NEX QC II supports quality control throughout the treated lumber production process, providing an affordable solution for optimizing product quality while reducing costs, minimizing product rejection, and reducing waste.