Application Note EDXRF1915

Scope
The analysis of copper (Cu) and iron (Fe) on Millipore and cation water filters is demonstrated.
Background
Excessive metal content can contribute to corrosion in the piping used in the cooling systems in power stations. Corrosion is minimized by the selection of metal alloys used for the pipes and the chemistry of the cooling water itself. The cooling water is monitored for excessive metal content using both Millipore and cation filters. The filters are then analyzed to determine concentrations of iron and copper, as well as other unwanted metals such as nickel, zinc and lead. To meet the analytical demands of the industry, Applied Rigaku Technologies offers the NEX DE EDXRF analyzer.
Calibration
Empirical calibrations are built using a set of filters assayed for the metal content to be measured. In this demonstration both Millipore and cation filters are included in a single calibration method.
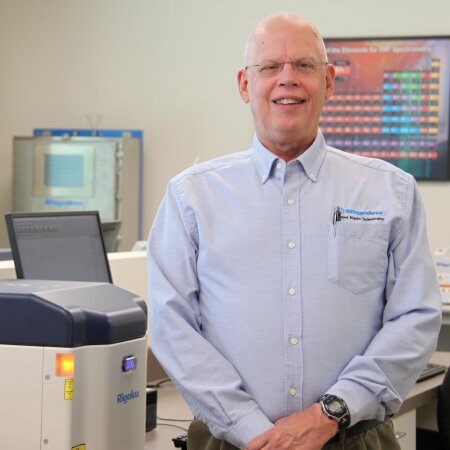
Table 1: Cu calibration| Element: Cu Units: ug/L |
||
| Sample I.D. | Standard value | Calculated value |
| 2 | 2.1 | 2.02 |
| 3 | 4.7 | 5.15 |
| 4 | 6.9 | 6.33 |
| 5 | 11.9 | 12.21 |
| 6 | 24.3 | 24.86 |
| 7 | 47.0 | 46.83 |
| 8 | 77.4 | 77.10 |
| 9 | 117.3 | 117.42 |
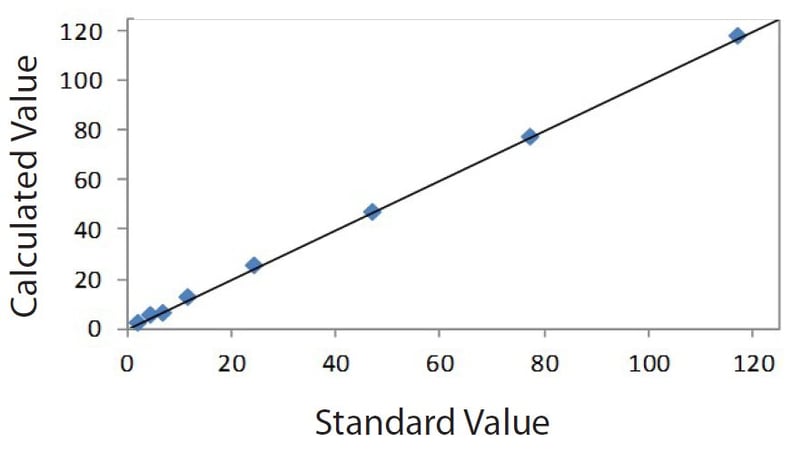 Figure 1: Correlation plot Cu
Table 2: Fe calibration
| Element: Fe Units: ug/L |
||
| Sample I.D. | Standard value | Calculated value |
| 2 | 18.0 | 17.35 |
| 3 | 41.7 | 41.08 |
| 4 | 58.3 | 57.71 |
| 5 | 100.7 | 100.20 |
| 6 | 204.9 | 210.20 |
| 7 | 397.1 | 397.10 |
| 8 | 653.2 | 650.00 |
| 9 | 990.5 | 991.60 |
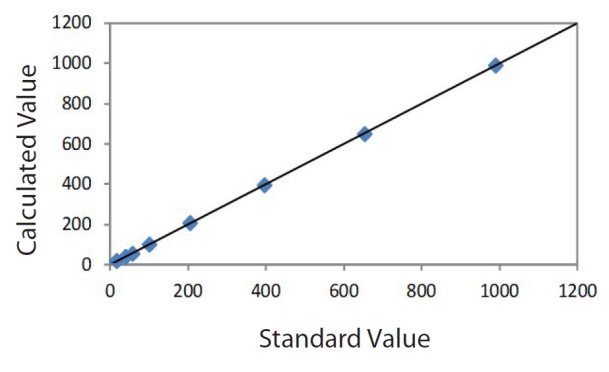 Figure 2: Correlation plot Fe
Depending on the particular analytical needs at the power station an alternate practice is to make separate calibrations for Millipore and cation filters. If other metals such as Ni, Zn and/or Pb occur in the water, simply obtain calibration standards that include those elements with known assay values.
Recovery and repeatability (precision)
To demonstrate typical measurement recovery and repeatability (precision), the low and high calibration standards were chosen. The average results and standard deviations are shown here.
| Element | Assay value | Average value | Std. dev. | Relative dev. |
| Cu | 2.1 | 2.03 | 0.10 | 4.8 |
| Fe | 18.0 | 17.8 | 0.3 | 1.7 |
| Element | Assay value | Average value | Std. dev. | Relative dev. |
| Cu | 117.3 | 116 | 1 | 0.9 |
| Fe | 990.5 | 993 | 5 | 0.5 |
Conclusion
The results demonstrated here show excellent sensitivity and precision for the measurement of metals in cooling waters.
Other metals such as nickel, zinc, and lead with middle energy X-rays will give the same performance as the copper and iron results. Advanced design features with the Rigaku Offset Spinner for increased surface area measured are combined with simple, intuitive software to make NEX DE an excellent tool for quality labs, R&D, and at-line monitoring by non- technical personnel.