Application Note EDXRF1576

Scope
The measurement of gold is demonstrated in used ore material such as from ore dumps and tailing piles. This application note also shows the recovery of uranium from the used ore material.
Background
Recovering gold and other valuable metals from used ore materials can be a profitable recovery venture. In the processing of ores, the desired metals and other base metals are extracted leaving mostly silicates, minerals, and the other base ore materials. Gold and other precious metals can be recovered by further processing and extraction of the ore material from used ore dumps or old tailing piles. To screen and measure the gold content, Applied Rigaku Technologies offers the NEX DE EDXRF system with a high-throughput SDD detector to give superior measurement of trace valuable metals in various used ore materials.
Calibration
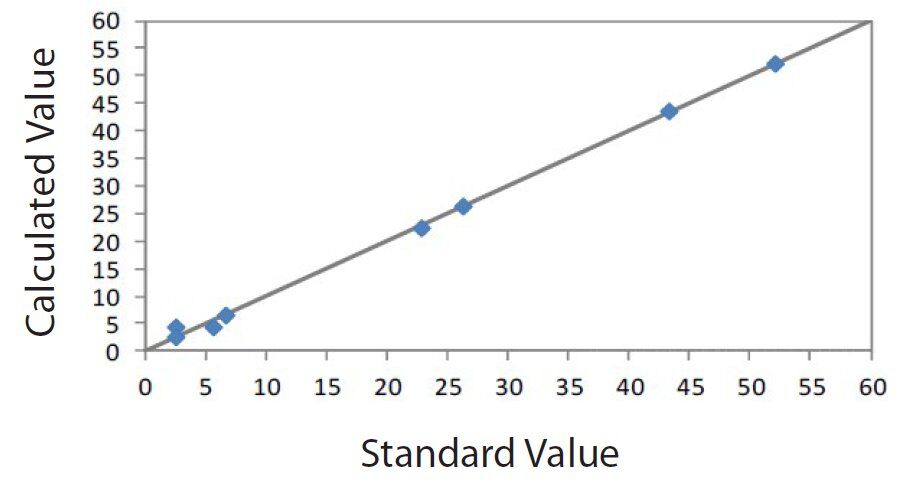
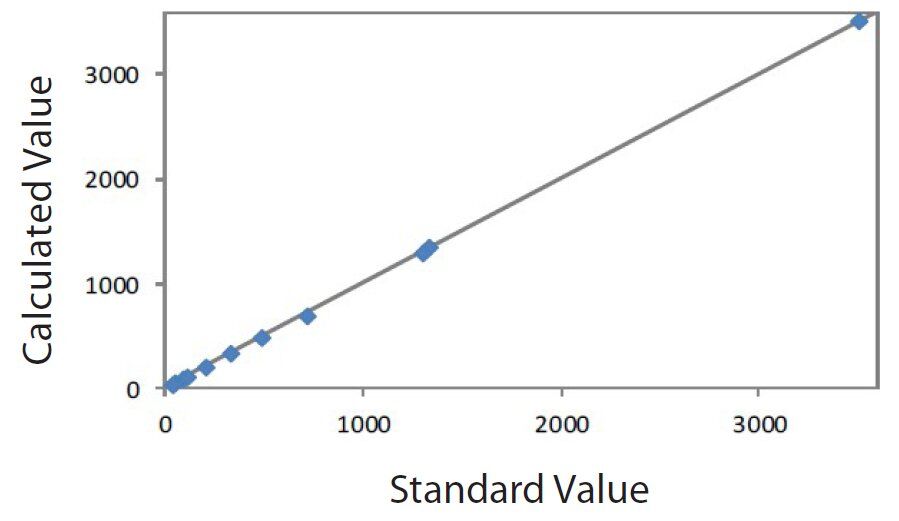
Because a high degree of accuracy is desired in the industry, the empirical regression calibration method is used. An empirical calibration was built using a set of 12 commercially available standards from AMIS (African Mineral Standards) that model used ore materials. Using the empirical approach, an overlap correction was employed to automatically compensate for the spectral overlap of the Zn-Kβ line on the Au-Lα line. Appropriate alpha corrections were enabled to compensate for various absorption/ enhancement matrix effects. A summary of the two empirical calibrations is shown here:
Table 1: Gold calibration
| Element: Au Units: g/ton |
||
| Sample I.D. | Standard value | Calculated value |
| 94 | 2.7 | 4.3 |
| 244 | 6.8 | 6.7 |
| 245 | 88.4 | 88.4 |
| 369 | 26.4 | 26.5 |
| 412 | 5.7 | 4.4 |
| 428 | 43.4 | 43.6 |
| 429 | 22.9 | 22.5 |
| 430 | 2.7 | 2.5 |
| 455 | 52.2 | 52.2 |

Figure 1: Correlation plot Au
Table 2: Uranium calibration
| Element: U Units: ppm |
||
| Sample I.D. | Standard value | Calculated value |
| 94 | 95 | 91 |
| 208 | 58 | 55 |
| 244 | 331 | 337 |
| 245 | 491 | 493 |
| 299 | 40 | 40 |
| 369 | 1340 | 1355 |
| 412 | 205 | 213 |
| 428 | 1309 | 1304 |
| 429 | 722 | 699 |
| 430 | 113 | 117 |
| 455 | 3512 | 3511 |

Figure 2: Correlation plot U
Repeatability
To demonstrate the repeatability and recovery of the measurement, three standards were measured 10 times each in static position. The average results and standard deviations are shown here.
| Sample: Standard 412 | Units: ppm | |||
| Sample I.D. | Standard value | Average value | Std. dev | % Relative dev |
| Au | 5.7 | 6.3 | 0.4 | 5.7% |
| U | 205 | 209 | 1.0 | 0.3% |
| Sample: Standard 245 | Units: ppm | |||
| Sample I.D. | Standard value | Average value | Std. dev | % Relative dev |
| Au | 88.4 | 86.9 | 1.7 | 1.9% |
| U | 491 | 496 | 1.0 | 0.1% |
| Sample: Standard 369 | Units: ppm | |||
| Sample I.D. | Standard value | Average value | Std. dev | % Relative dev |
| Au | 26.36 | 27.3 | 0.9 | 3.4% |
| U | 1340 | 1346 | 1.0 | 0.11% |
Conclusion
The NEX DE offers analysts and technicians a simple yet powerful and versatile system for quantifying elemental composition. The results of this study indicate that given matrix-matched calibration and proper sampling, the Rigaku NEX DE EDXRF can achieve excellent results for monitoring and measuring the concentration of gold and other valuable elements in the recovery of used ore materials.

