Application Note EDXRF1537

Scope
The at-line analysis of gold (Au) in impregnated stripping solutions during the electrowinning process is demonstrated.
Background
Gold ore processors commonly utilize the cyanide leaching technique to recover trace gold content. After the gold is leached out of the ore, it is typically absorbed onto activated carbon in processes such as Carbon-in-Pulp (CIP), Carbon-in-Leach (CIL), or Carbon Column (CC). Once absorbed, the gold is stripped from the carbon, and the impregnated stripping solution is fed into the electrowinning process where the gold is recovered by electrolysis. By measuring the gold in the stripping solution at-line, operators can quickly and easily determine when the solution will be barren of gold, significantly improving the plant’s efficiency. The Rigaku NEX DE offers a simple and affordable at-line analytical technique for measuring such solutions. Non-technical operators obtain results in as little as 100 – 300 seconds, without the need for special sample preparation, sample conditioning, or technical knowledge.
Unit conversion
The simple conversion shown here is made without conversion for relationship between volume of liquid solution to volume of ore material.
1 troy oz/ton = 34.3 ppm
1 ppm = 0.029 troy oz/ton
Calibration
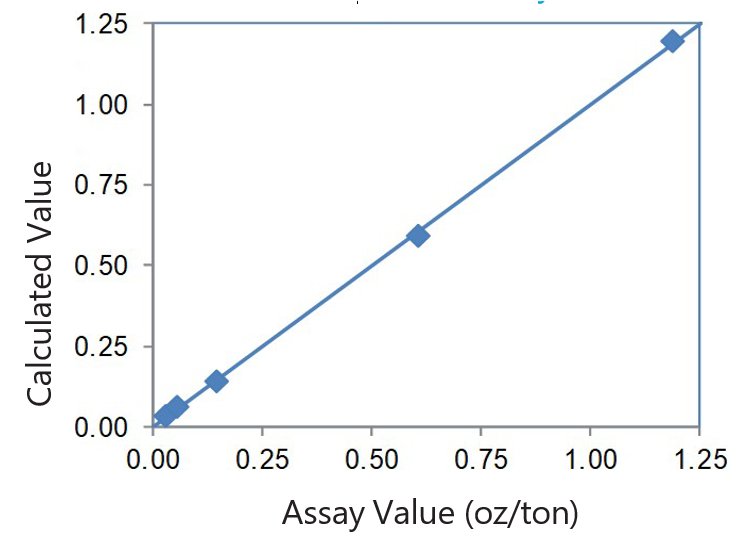
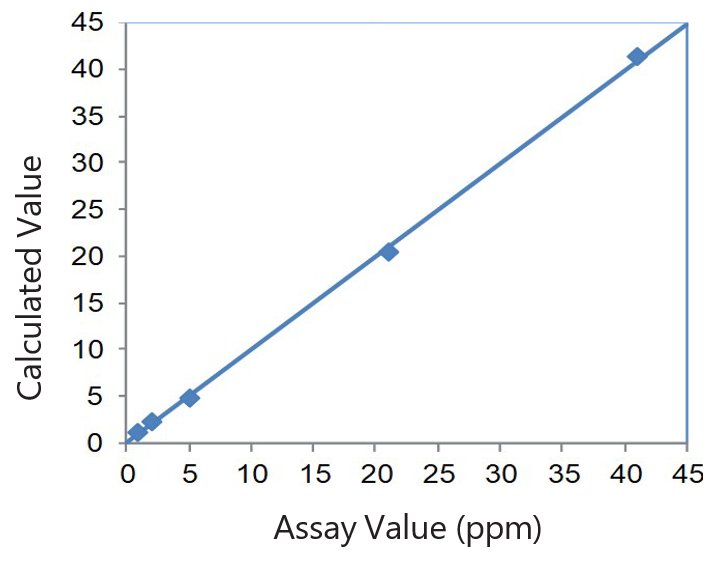
A simple linear empirical calibration was built using a suite of 5 calibration standards assayed by AAS. Calibration can be made in units of ppm or troy oz/ton.
| Element: Au Units: troy oz/ton |
||
| Sample I.D. | Assay value | Calculated value |
| 1 | 0.029 | 0.035 |
| 2 | 0.058 | 0.064 |
| 5 | 0.145 | 0.142 |
| 21 | 0.609 | 0.592 |
| 41 | 1.189 | 1.198 |
 Correlation plot Au troy oz/ton
| Element: Au Units: ppm |
||
| Sample I.D. | Assay value | Calculated value |
| 1 | 1.0 | 1.2 |
| 2 | 2.0 | 2.2 |
| 5 | 5.0 | 4.9 |
| 22 | 21.0 | 20.4 |
| 41 | 41.0 | 41.3 |
 Correlation plot Au ppm
Precision
Instrument repeatability (precision) is determined by ten repeat analyses of a sample in static position. Precision results are summarized here.
| Element: Au | Units: troy oz/ton | ||
| Sample | Standard value | Average value | Std dev |
| 2 | 0.058 | 0.067 | 0.003 |
| 41 | 1.189 | 1.186 | <0.003 |
| Element: Au | Units: ppm | ||
| Sample | Standard value | Average value | Std dev |
| 2 | 2.0 | 2.3 | 0.1 |
| 41 | 41.0 | 40.9 | <0.1 |
Conclusion
The NEX DE offers analysts and technicians a simple yet powerful and versatile system for quantifying elemental composition using the empirical approach. The results of this study indicate that given stable samples, proper sample handling, and proper calibration technique, the Rigaku NEX DE EDXRF can achieve excellent results in monitoring the concentration of gold in strip solution during the processing of ores, tailings, and slags.

