Application Note EDXRF1495
Scope
The analysis of Pb/Zn ore is demonstrated using empirical calibration method.
Background
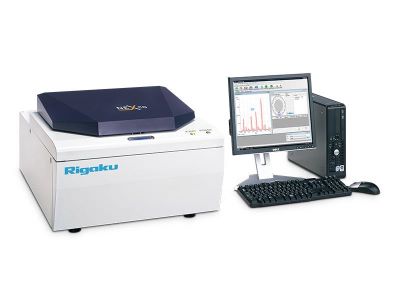
 Elemental analysis is important in the analysis of ores, from screening at the mine site and throughout the processing areas to final analysis. Majors and minors are important during processing, to ensure proper extraction and process control. Trace elemental analysis, especially of precious metals, is also extremely important to ensure the value of the processing is optimized. In lead/zinc ores the money elements are lead, zinc and in some ores silver, as well. Along the entire processing line, a fast and simple technique is required to monitor these and other elements. Rigaku offers the NEX CG EDXRF elemental analyzer to meet these industry challenges. The NEX CG, using indirect excitation and polarization, is a powerful, yet simple tool for the measurement of the elements sodium through uranium in rocks and ores.
 Model: NEX CG
Calibration
A single calibration method was created using the 12 assayed standards. Empirical calibrations were built for each assayed element in the sample matrix and alpha corrections were then employed to automatically compensate for variations in X-ray absorption and enhancement effects within the sample due to the independent variations in element concentration. A summary of each empirical calibrations is shown here.
| Component | Concentration range (%) |
| Zn | 9.89 - 54.53 |
| Pb | 0.48 - 2.91 |
| Fe | 4.78 - 22.43 |
| Ni | 0.027 - 0.091 |
| As | 0.113 - 0.362 |
| Cu | 0.018 - 0.105 |
| Ag | 0.0036 - 0.0144 |
| Cd | 0.072 - 0.114 |
Recovery and precision
Two standards were selected from the calibration and were analyzed against the calibration curves to demonstrate recovery and repeatability (precision). Each sample was measured in static position for ten repeat analyses with typical performance results shown below.
| Sample ID: A Units: Mass % |
||||
| Component | Standard value | Average value* | Std dev | % Relative |
| Fe | 22.43 | 22.37 | 0.05 | 0.2 |
| Ni | 0.091 | 0.091 | 0.002 | 2.2 |
| Cu | 0.029 | 0.028 | 0.002 | 6.9 |
| Zn | 18.03 | 18.08 | 0.09 | 0.5 |
| As | 0.362 | 0.367 | 0.005 | 1.4 |
| Pb | 0.700 | 0.734 | 0.004 | 0.6 |
* Average value reflects calculated value from the empirical calibration.
| Sample ID: B Units: Mass % |
||||
| Component | Standard value | Average value* | Std dev | % Relative |
| Fe | 4.78 | 4.44 | 0.03 | 0.6 |
| Ni | 0.042 | 0.040 | 0.001 | 2.4 |
| Cu | 0.084 | 0.082 | 0.002 | 2.4 |
| Zn | 53.69 | 53.57 | 0.30 | 0.6 |
| As | 0.129 | 0.133 | 0.004 | 3.1 |
| Cd | 0.096 | 0.091 | 0.003 | 3.1 |
| Pb | 2.91 | 2.86 | 0.02 | 0.7 |
| Ag | 0.0073 | 0.0071 | 0.0011 | 15 |
* Average value reflects calculated value from the empirical calibration.
Qualitative analysis
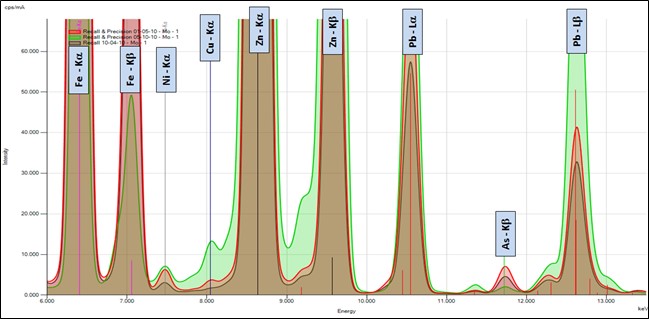
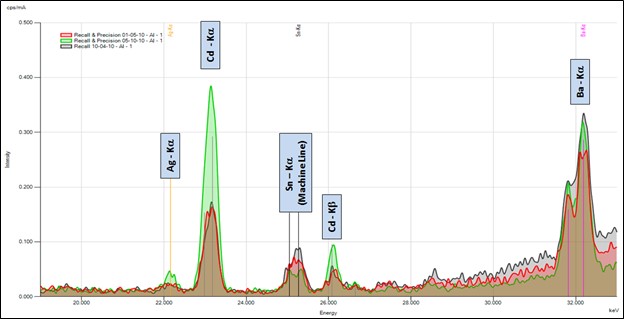
Spectral analyses of each of the samples show clear isolation of the respective peaks of interest. Select spectra are overlaid and provided below.
 Spectra on the Mo secondary target
 Spectra on the Al secondary target
Conclusion
Given homogeneous samples and proper calibration the Rigaku NEX CG yields excellent performance for the elemental analysis of lead/zinc ore. Empirical calibration based on matrix-matched is used to achieve optimum accuracy. If desired, semi-quantitative analysis can be made using Rigaku RPF-SQX Fundamental Parameters (FP) without any assayed reference material to screen with accuracy on the order of 20% relative. FP accuracy can be improved to the order of 5-10% relative by simply creating a Matching Library with only a few assayed samples of the material type. These features make the NEX CG an ideal EDXRF tool for screening and characterization of lead/zinc ore at the mine site or processing facilities for optimum product QA/QC.

