Application Note EDXRF1366

Scope
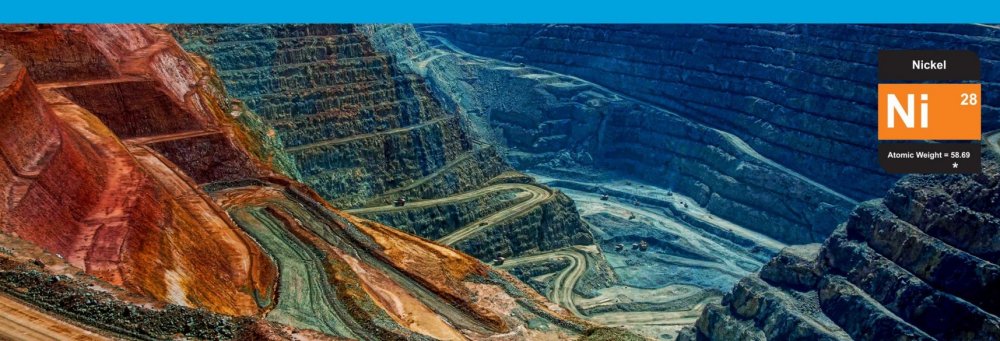
This application note uses NEX QC+ to demonstrate the analysis of important metal oxides in nickel ore using the empirical approach.
Background
During site characterization and preparation for smelting, it is important to determine concentrations of various metals in nickel ores. While NiO and Fe₂O₃ are the most important metal oxides, TiO₂, Cr₂O₃, and MnO may also be present in significant quantities. Characterizing the ore is important to determine potential yield, as well as during extraction and smelting. EDXRF is an excellent tool for mine site exploration and characterization, and can be used throughout the processing steps, extraction, and smelting to measure the ore material, concentrate, matte, filter cakes, and slags.
Calibration
20 site-specific calibration standards were supplied as pressed pellets for empirical calibration. Optimum calibration can be achieved using standards that represent the ore material at the site, where each standard is assayed for all oxides of interest and concentrations evenly span each range and vary independently. Given assays for light element oxides such as Al₂O₃, SiO₂, and SO₃, those calibrations can be made as well.
| Component | Concentration range (mass%) | Standard error of estimate |
| NiO | 0.06 – 3.00 | 0.0146 |
| Fe₂O₃ | 8 – 66 | 0.2306 |
| TiO₂ | 0.01 – 2.41 | 0.0184 |
| Cr₂O₃ | 0.04 – 3.64 | 0.0296 |
| MnO | 0.10 – 2.00 | 0.0157 |
Standard sample recovery and precision
Representative low, medium, and high NiO concentration calibration standards were measured 10 consecutive times each in a static position to demonstrate effective recovery and analytical precision.
| Sample ID: Sample ST14 Units: Mass% |
|||
| Oxide | Assay value | NEX QC+ average value | Std. dev |
| NiO | 2.98 | 3.00 | 0.003 |
| Fe₂O₃ | 21.71 | 21.89 | 0.02 |
| TiO₂ | --- | 0.019 | 0.004 |
| Cr₂O₃ | 1.07 | 1.106 | 0.007 |
| MnO | 0.38 | 0.366 | 0.002 |
| Sample ID: Sample S103 Units: Mass% |
|||
| Oxide | Assay value | NEX QC+ average value | Std. dev |
| NiO | 1.28 | 1.297 | 0.006 |
| Fe₂O₃ | 65.63 | 66.19 | 0.07 |
| TiO₂ | 0.05 | 0.051 | 0.003 |
| Cr₂O₃ | 3.64 | 3.636 | 0.015 |
| MnO | 1.16 | 1.178 | 0.008 |
| Sample ID: Sample 1696 Units: Mass% |
|||
| Oxide | Assay value | NEX QC+ average value | Std. dev |
| NiO | 0.73 | 0.746 | 0.003 |
| Fe₂O₃ | 12.21 | 12.16 | 0.02 |
| TiO₂ | 0.18 | 0.166 | 0.004 |
| Cr₂O₃ | 0.32 | 0.322 | 0.003 |
| MnO | 0.20 | 0.190 | 0.001 |
| Sample ID: Sample 1702 Units: Mass% |
|||
| Oxide | Assay value | NEX QC+ average value | Std. dev |
| NiO | 0.26 | 0.257 | 0.001 |
| Fe₂O₃ | 12.14 | 12.05 | 0.02 |
| TiO₂ | 0.30 | 0.292 | 0.005 |
| Cr₂O₃ | 0.23 | 0.238 | 0.002 |
| MnO | 0.20 | 0.204 | 0.001 |
Analysis of unknown samples
Unknown samples with expected values were submitted from the mine site for measurement against the calibrations built. Results are shown below.
| Sample ID | NiO | Fe₂O₃ | TiO₂ | Cr₂O₃ | MnO | |||||
| Expected Mass% | Measured Result | Expected Mass% | Measured Result | Expected Mass% | Measured Result | Expected Mass% | Measured Result | Expected Mass% | Measured Result | |
| ST11 | 2.41 | 2.43 | 24.95 | 25.27 | <0.01 | 0.03 | 1.21 | 1.31 | 0.38 | 0.38 |
| ST16 | 2.04 | 2.05 | 15.37 | 15.32 | <0.01 | ND | 1.23 | 1.22 | 0.22 | 0.25 |
| ST20 | 1.79 | 1.76 | 65.45 | 64.96 | <0.01 | 0.05 | 2.73 | 3.08 | 1.22 | 1.24 |
| AP06 | 1.33 | 1.41 | 16.38 | 17.17 | 0.02 | 0.03 | 0.60 | 0.63 | 0.27 | 0.27 |
Conclusion
The NEX QC+ offers analysts a simple yet powerful and versatile system for quantifying elemental composition using the empirical approach. The results of this study indicate that given stable samples, proper sample handling and proper calibration technique, the Rigaku NEX QC+ EDXRF can achieve excellent results for the measurement of the key metal oxides NiO, Fe₂O₃, TiO₂, Cr₂O₃ and MnO in nickel ores.

