Application Note EDXRF1273

Scope
This application note uses NEX QC+ to demonstrate the analysis of finished Portland cement using the empirical approach.
Background
X-ray fluorescence (XRF) spectroscopy is a well-established technique used in cement plants around the world. The technique is ideal for quality control (QA/QC) throughout the cement production process. Energy dispersive X-ray fluorescence (EDXRF) spectrometry is a routinely employed screening and quality control tool employed to ensure proper composition of incoming feedstocks, raw meal mixture balances, addition of gypsum, and throughout the manufacturing process. EDXRF analyzers are also commonly deployed as backup instruments for WDXRF spectrometers used for final QC and certification.
Calibration — single position
Empirical calibrations were built using a set of 8 NIST SRM certified standards: 1880b, 1881a, 1884b, 1885a, 1886a, 1887a, 1888a, 1889a. Using the empirical approach, “alpha corrections” are then employed to automatically compensate for variations in X-ray absorption and enhancement effects within the sample due to the independent variations in element concentration, thus yielding a very accurate model characterizing the cement type.
The single-position window ring was used, giving the optimum sensitivity for Na, Mg, Al, and Si. The 6-position autosampler can be used for its ease of use, allowing for multiple calibration or unknown samples to be measured without an operator attending the analyzer. Due to a slight difference in sample height, a small change in sensitivity and performance may be seen.
A summary of a typical finished Portland cement empirical calibration is shown here.
| Component | Concentration range (Mass%) |
| SiO₂ | 18.637 – 22.380 |
| Al₂O₃ | 3.875 – 7.060 |
| Fe₂O₃ | 0.152 – 3.681 |
| CaO | 57.58 – 67.87 |
| MgO | 0.814 – 4.740 |
| SO₃ | 2.086 – 4.622 |
| Na₂O | 0.091 – 1.068 |
Recovery and repeatability
To demonstrate repeatability (precision), the low and high calibration standards were chosen. Each sample was measured in a static position for ten repeat analyses with typical results shown below.
| NIST SRM 1887a | SiO₂ | Al₂O₃ | Fe₂O₃ | CaO | MgO | SO₃ | Na₂O |
| Standard value | 18.64 | 6.20 | 2.86 | 60.90 | 2.84 | 4.62 | 0.48 |
| Average value | 18.78 | 6.36 | 2.81 | 61.90 | 2.99 | 4.65 | 0.68 |
| Standard deviation | 0.03 | 0.03 | 0.01 | 0.07 | 0.04 | 0.02 | 0.05 |
Reporting results
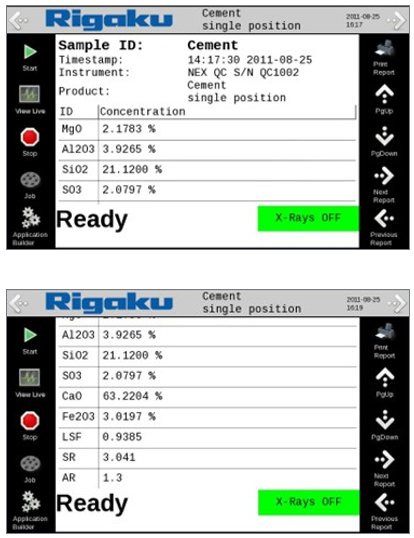
Analysis results are reported on the main screen and printed. Simply scroll down to see the Lime Saturation Factor, Silicon Ratio, and Aluminum Ratio.
 Conclusion
During the entire production and processing cycle, oxide composition of the cement material must be reliably monitored to ensure optimal process control, physical characteristics of the cement, as well as profitability. The Rigaku NEX QC+ gives the cement plant a reliable and rugged low-cost system for quality control measurements around the plant, making it an ideal tool throughout the quality control process and as a backup to WDXRF systems. Similar performance as shown here is also applicable to clinker and raw meal materials, and can be used simply to measure gypsum (SO₃) in finished cement.

