Application Note EDXRF1225

Scope
This application note demonstrates the measurement of Ammonia Copper Zinc Arsenate (ACZA) treated wood and wood treatment solutions using NEX QC.
Background
Wood treatments are used to protect lumber from fungi, insects, UV damage, and general wear. Common wood treatment formulations contain only Copper, CCA, Penta, and ACZA. ACZA is often used to treat wood species that do not easily retain other treatments, such as Douglas fir. When treating wood, the proper balance of treatment solution must be monitored to ensure the highest quality while minimizing waste and excess cost due to treatment usage or product rejection. Copper, Zinc and Arsenic levels are monitored in solution prior to treatment, and then in the wood to ensure proper retention. A quick, simple, reliable means of analysis is required throughout the quality control process. XRF is an ideal tool for such analysis.
Calibration – ACZA in wood
An empirical calibration was built using a set of assayed wood standards.
| Element: CuO Units: % |
||
| Sample I.D. | Standard value | Calculated value |
| W-A | 0.518 | 0.531 |
| W-B | 0.789 | 0.788 |
| W-C | 1.150 | 1.145 |
| W-D | 0.989 | 0.963 |
| W-F | 1.660 | 1.685 |
| W-G | 2.990 | 2.984 |
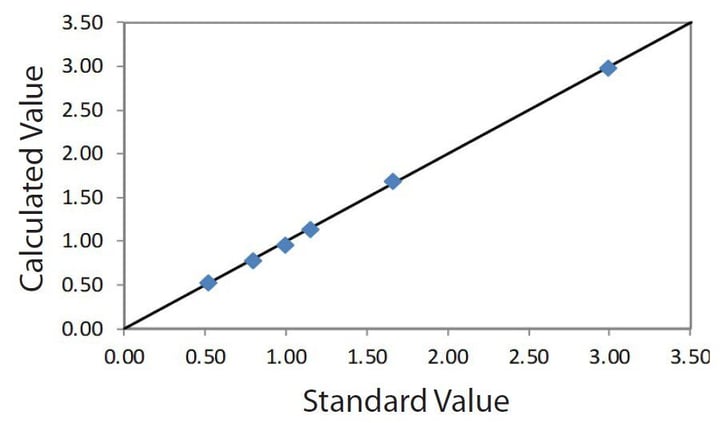
Correlation plot CuO in wood
| Element: ZnO Units: % |
||
| Sample I.D. | Standard value | Calculated value |
| W-A | 0.264 | 0.266 |
| W-B | 0.382 | 0.381 |
| W-C | 0.518 | 0.506 |
| W-D | 0.457 | 0.464 |
| W-F | 0.771 | 0.775 |
| W-G | 1.440 | 1.439 |
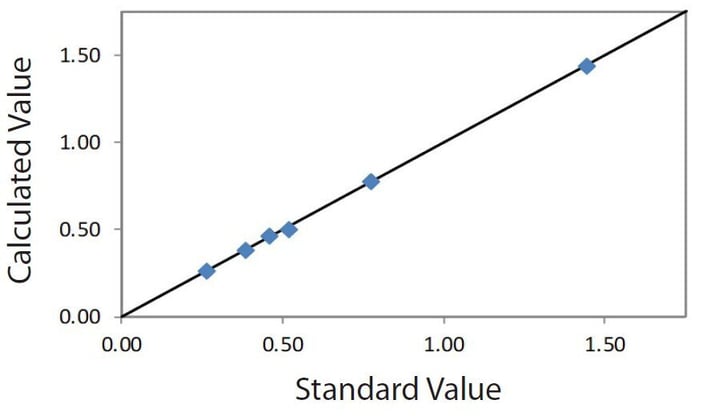 Correlation plot ZnO in wood
| Element: As₂O₅ Units: % |
||
| Sample I.D. | Standard value | Calculated value |
| W-A | 0.189 | 0.199 |
| W-B | 0.293 | 0.285 |
| W-C | 0.421 | 0.396 |
| W-D | 0.368 | 0.389 |
| W-F | 0.632 | 0.594 |
| W-G | 1.280 | 1.281 |
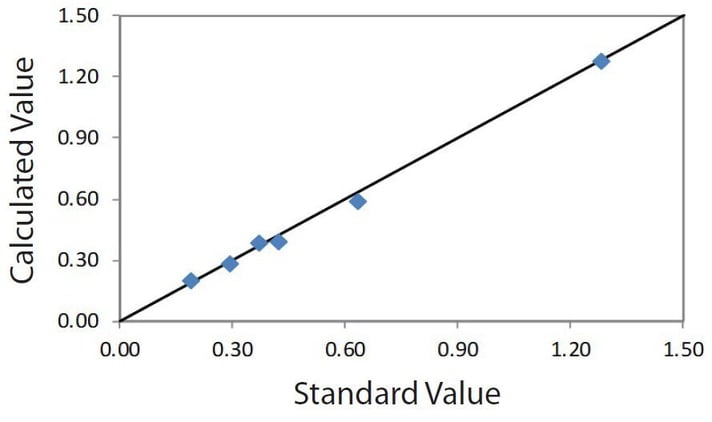 Correlation plot As₂O₅ in wood
Repeatability – ACZA in wood
To demonstrate repeatability (precision), the low and high samples were chosen from the set of calibration standards. Each sample was measured in static position.
| Element: CuO Units: % |
||||
| Sample I.D. | Standard value | Average value | Std. dev | % Relative |
| W-A | 0.518 | 0.5209 | 0.0014 | 0.3 |
| W-G | 2.990 | 3.047 | 0.015 | 0.5 |
| Element: ZnO Units: % |
||||
| Sample I.D. | Standard value | Average value | Std. dev | % Relative |
| W-A | 0.264 | 0.2601 | 0.0010 | 0.4 |
| W-G | 1.440 | 1.455 | 0.005 | 0.4 |
| Element: As₂O₅ Units: % |
||||
| Sample I.D. | Standard value | Average value | Std. dev | % Relative |
| W-A | 0.189 | 0.1874 | 0.0011 | 0.5 |
| W-G | 1.280 | 1.289 | 0.002 | 0.2 |
Calibration – ACZA in solution
An empirical calibration was built using a set of assayed solution standards.
| Element: CuO Units: % |
||
| Sample I.D. | Assay value | Calculated value |
| S-A | 0.53 | 0.552 |
| S-B | 1.03 | 1.032 |
| S-C | 1.56 | 1.541 |
| S-D | 2.11 | 2.061 |
| S-E | 2.52 | 2.574 |
| S-F | 5.09 | 5.086 |
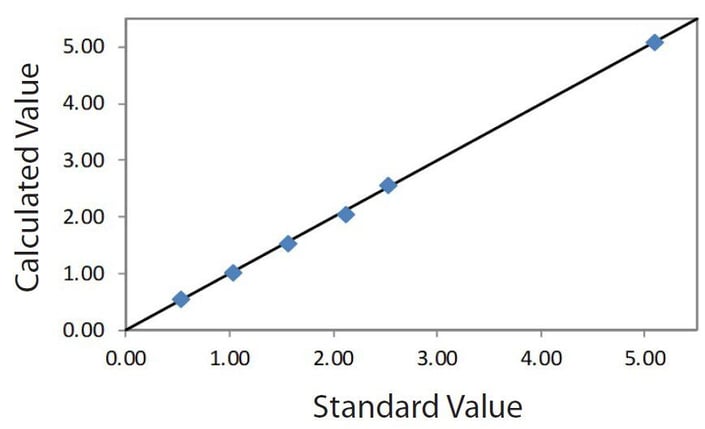 Correlation plot CuO in solution
| Element: ZnO Units: % |
||
| Sample I.D. | Assay value | Calculated value |
| S-A | 0.26 | 0.290 |
| S-B | 0.52 | 0.510 |
| S-C | 0.76 | 0.759 |
| S-D | 1.01 | 1.019 |
| S-E | 1.30 | 1.281 |
| S-F | 2.49 | 2.495 |
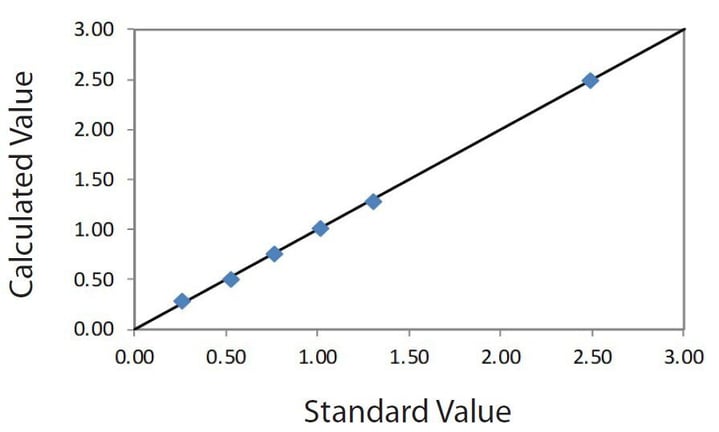 Correlation plot ZnO in solution
| Element: As₂O₅ Units: % |
||
| Sample I.D. | Assay value | Calculated value |
| S-A | 0.26 | 0.285 |
| S-B | 0.53 | 0.528 |
| S-C | 0.80 | 0.788 |
| S-D | 1.08 | 1.039 |
| S-E | 1.30 | 1.334 |
| S-F | 2.63 | 2.633 |
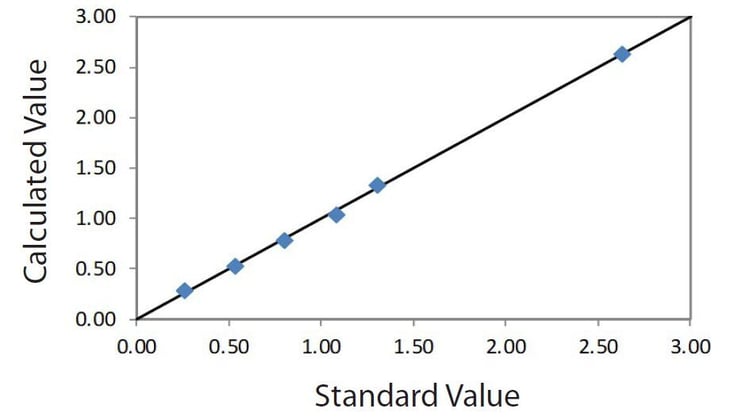 Correlation plot As₂O₅ in solution
Repeatability – ACZA in solution
To demonstrate repeatability (precision), the low and high samples were chosen from the set of calibration standards. Each sample was measured in static position.
| Element: CuO Units: % |
||||
| Sample I.D. | Standard value | Average value | Std. dev | % Relative |
| S-A | 0.53 | 0.525 | 0.003 | 0.6 |
| S-F | 5.09 | 5.088 | 0.027 | 0.5 |
| Element: ZnO Units: % |
||||
| Sample I.D. | Standard value | Average value | Std. dev | % Relative |
| S-A | 0.26 | 0.263 | 0.002 | 0.8 |
| S-F | 2.49 | 2.479 | 0.008 | 0.3 |
| Element: As₂O₅ Units: % |
||||
| Sample I.D. | Standard value | Average value | Std. dev | % Relative |
| S-A | 0.26 | 0.269 | 0.002 | 0.7 |
| S-F | 2.63 | 2.618 | 0.021 | 0.8 |
Reliable measurement of Cu and Zn
Past generations of analyzers used gas-filled proportional counter detectors, called prop counters. The prop counter detection system yields broad peaks, therefore Cu and Zn are measured as one peak, as shown in Spectrum 1 below. The single peak detected by a prop counter must be separated into Cu and Zn measurements using large mathematical overlap correction factors or sequential use of Ross filters that double the count time.
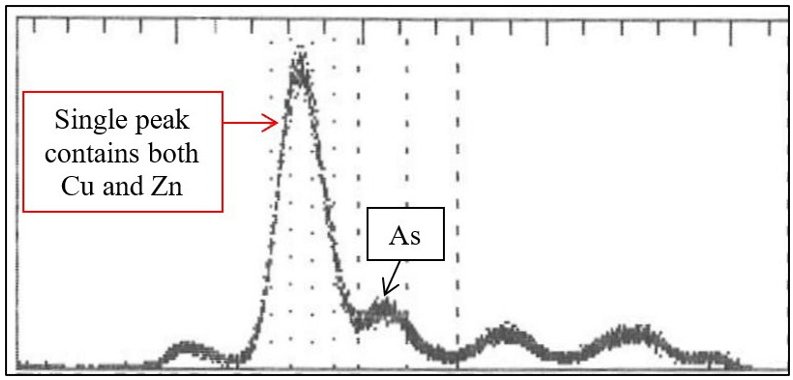 Spectrum 1. Typical prop counter ACZA spectrum, giving one single peak for Cu and Zn that must be heavily deconvoluted.
The NEX QC solves this problem by using a rugged and reliable semiconductor detector that gives much sharper resolution of peaks. Spectrum shows the ACZA analysis using NEX QC, the measurement of the individual Cu and Zn is possible without the extra error introduced using large mathematical overlap corrections or the use of Ross filters.
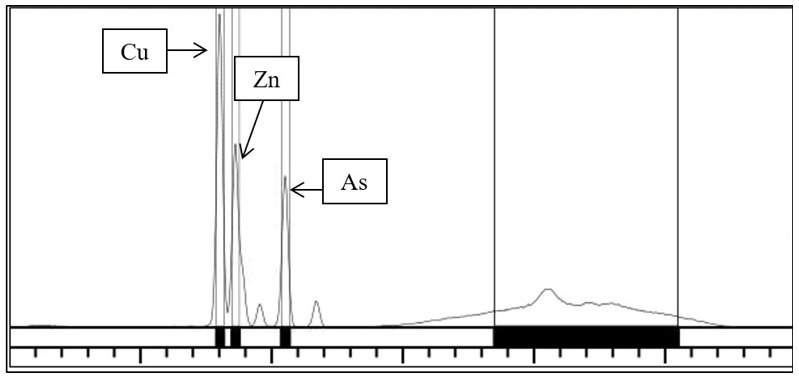 Spectrum 2. Typical NEX QC ACZA spectrum, showing clear, distinct peaks for Cu, Zn, and As.
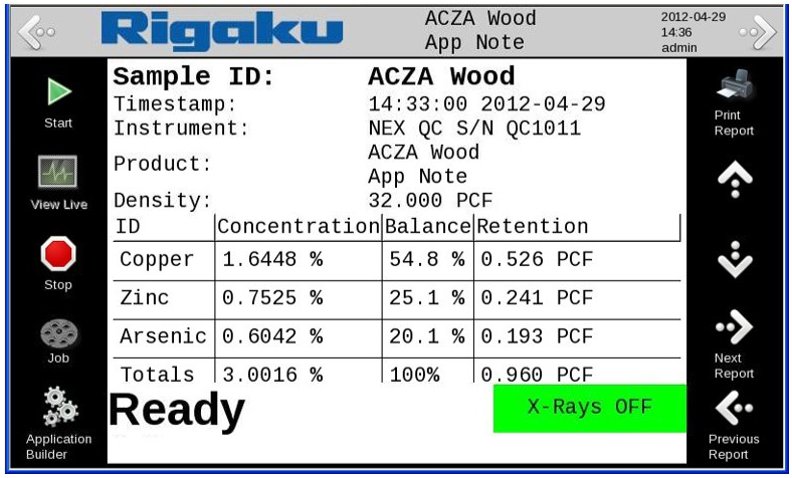
Retention report
To measure a wood sample, enter the density of the wood. The measurement calculates concentrations of CuO, ZnO, and As₂O₅ and also outputs balance and retention values.
Conclusion
The typical results detailed here show exceptional performance for the fast and simple measurement of ACZA in wood and solution, without the need for large overlap corrections or Ross filters. The Rigaku NEX QC is an excellent tool throughout the QC process in producing treated lumber, giving the production process an affordable means of optimizing quality while minimizing costs and helping to minimize product rejection and waste.

