
Sample observation software
Sample observation software and its distinctive ChromTA™ chromatic thermal analysis function
Sample observation software adds visual information to thermal analysis by enabling real-time observation and recording of sample changes during measurement. By synchronizing thermal analysis data with observation images, users can intuitively identify what thermal event occurs in the sample at the timing of mass changes or other characteristic changes.
This helps clarify phenomena that are difficult to interpret from curve data alone, such as color changes, melting, foaming, deformation, shrinkage, and expansion.
With the newly added ChromTA™ chromatic thermal analysis function, color changes that occur during heating and cooling can also be captured continuously and evaluated in synchronization with thermal analysis data. By converting observation images into color data, ChromTA enables continuous and quantitative analysis of sample color changes. This allows changes that were previously invisible to conventional thermal analysis to be visualized through both color variations and numerical data.
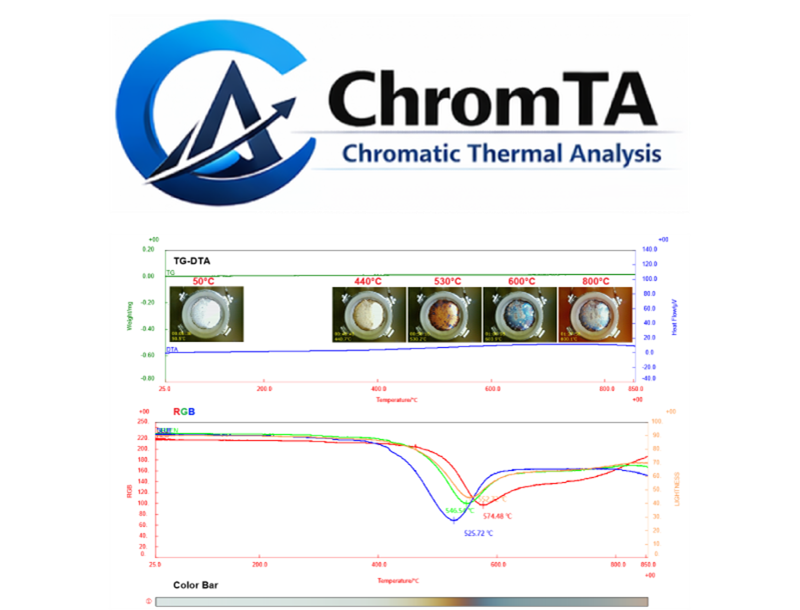
Sample observation software Overview
Intuitive visualization of thermal analysis data and sample changes
Sample observation software enables real-time monitoring of the sample condition during thermal analysis measurements. Changes caused by temperature, such as color change, shape change, melting, foaming, shrinkage, expansion, and deformation, can be recorded as images. This makes it easier to visually confirm phenomena that may be difficult to interpret from TG, DTA, DSC, and other thermal analysis data alone.
The acquired observation images can be displayed in synchronization with the measurement data, allowing users to check the sample image corresponding to any selected temperature or time on the graph. This helps users understand the actual sample behavior at the moment when mass change, thermal events, or other characteristic changes occur.
Multiple observation images can also be compared side by side or overlaid to efficiently review sample changes during heating and cooling. Slide show display and video creation functions support the preparation of measurement reports, technical presentations, and explanatory materials for internal and external communication.
By adding visual information to thermal analysis data, the software deepens understanding of material behavior and strengthens the reliability and persuasiveness of analysis results.
ChromTA™ is a new function in the sample observation software. By acquiring color changes from observation images as numerical data and analyzing them in synchronization with thermal analysis data, sample changes are transformed from “visible information” into “measurable information.”
New function: Chromatic thermal analysis ChromTA
―A new perspective for thermal analysis: Color. See more, understand more, and transform thermal analysis through color-based insight into thermal behavior.
ChromTA is a Rigaku-exclusive chromatic thermal analysis function built into the sample observation software.
It continuously acquires color changes that occur in the sample during heating and cooling from observation images as numerical data, and analyzes them in synchronization with thermal analysis data. This enables color changes that were previously confirmed only as observation images to be evaluated as quantitative information corresponding to temperature and time.
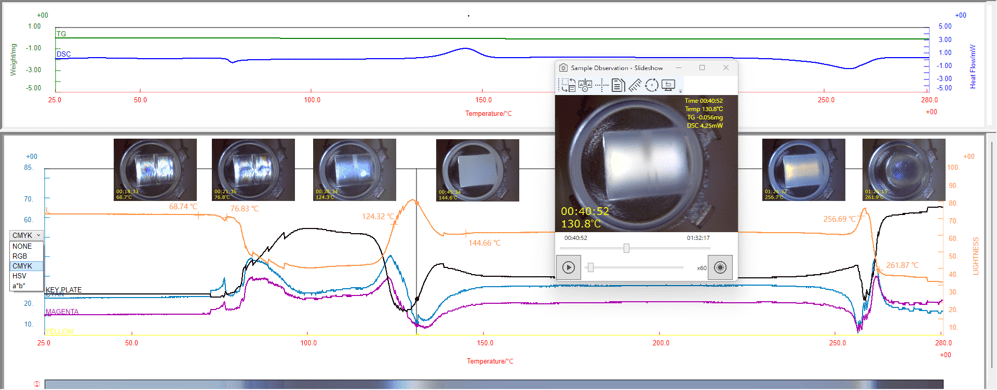 Note: The image is for illustrative purposes only and differs from the actual software screen.
What sample observation software can do
- Observe the sample condition in real time during measurement
- Synchronize thermal analysis data, observation images, and color changes
- Check observation images corresponding to any point on the graph
- Display observation images as a slide show, compare multiple images side by side, or overlay images
- Measure dimensions on observation images, use digital zoom, and display grids
- Use observation images for measurement reports and explanatory materials
- Analyze color changes as numerical data (ChromTA)
- Generate individual color trend graphs for up to six selected regions within a sample (ChromTA)
- Create videos from observation images
Sample observation software Features
Sample observation software Videos
Sample observation software Application Notes
The following application notes are relevant to this product
-
B-TA1086 - Analysis of Polymorphic Transition of Carbamazepine -Sample Observation DSC, ChromTA (Chromatic Thermal Analysis)
-
B-TA1085 - Analysis of Amorphous PMMA -Sample Observation STA, ChromTA (Chromatic Thermal Analysis)
-
B-TA1082 - Analysis of amorphous PET -Sample Observation STA, ChromTA (Chromatic Thermal Analysis)
-
B-TA1083 - Color Change Induced by Surface Oxidation of Stainless steel Sample Observation STA; ChromTA

Contact Us
Whether you're interested in getting a quote, want a demo, need technical support, or simply have a question, we're here to help.