Application Note RACCT9031
About the sample: Plastic locking parts
Plastic parts are often used for various locking mechanisms. You see them in electronic connectors, pen caps, pill and cosmetics containers, lunch boxes, etc. All parts need to be manufactured correctly for the locking mechanism to work. If the dimensions of the plastic part deviate from the design, the lock can be too loose or tight or not work at all. When a lock feels a little loose or tight, how can you tell where the dimension deviation resides? X-ray CT (computed tomography) can image these plastic parts in the locked position and compare their dimensions with the original design or between different parts. The results can be represented as a color-coded distribution of the dimensional deviation and provide crucial insight to solve design or production problems.
Analysis procedure
- In this example, two plastic locking parts, one loose and one tight, were scanned using a micro-CT scanner, CT Lab HX.
- The entire surfaces were detected using the ISO-50 surface determination technique.
- Two parts' dimensions were compared.
1. CT scan
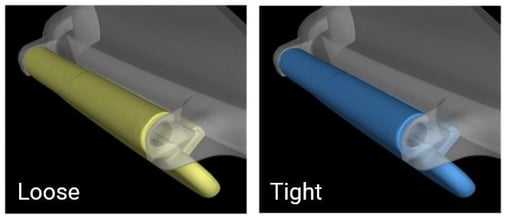
We examined a plastic sleeve that wraps around a cylinder-shaped core to lock down a lid of a container. Two plastic locking parts, one loose and one tight, were scanned to produce the 3D grayscale CT image.
2. Surface detection
The entire surfaces were detected using the ISO-50 surface determination technique.

3. Comparison of two parts
The detected surfaces of the two parts were compared to calculate the dimensional difference. This figure shows the difference between the loose and tight locking sleeves. Green indicates that the two parts match. Red (positive deviation) means that the tight sleeve's surface is shifted inward. Blue (negative deviation) indicates that the tight sleeve's surface is shifted outward.
The two ends of the part appear red. It indicates that the tightness difference between the two locks comes from their shape difference at these two locations.

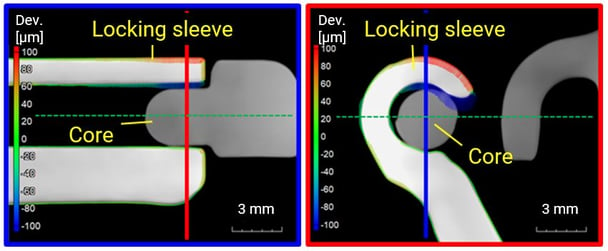
These two figures show cross-sections in parallel and perpendicular directions to the cylinder-shaped core as indicated by the blue and red arrows.
The white part is the loose sleeve. The tight sleeve's deviation from it is represented with colored lines perpendicular to the object's surface. The length of these lines represents the amount of deviation and the color indicates positive (red) and negative (blue) deviations.
These two cross-sections show that the tight sleeve has a smaller radius and wraps the core more tightly. You can tell from this analysis that the "tightness" difference felt between the two parts translates to roughly 100 microns of dimensional difference.

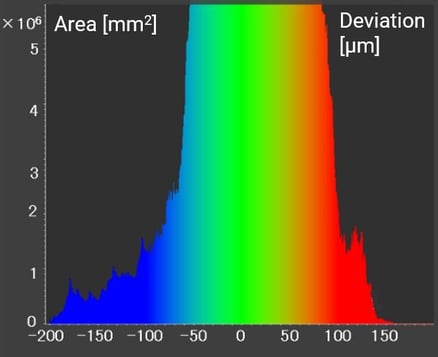
This graph shows an area distribution versus the dimensional deviation between the two parts. You can see that the majority of the part dimensions match, but there are about 1 - 2 x 10^6 square millimeters areas showing over 100-micron deviations.


