Application Note RACCT9016
About the sample: Cracked rocks, bricks, and concrete
Rocks, bricks, and concrete can have cracks for various reasons. X-ray CT computed tomography is a convenient technique to visualize the cracks without altering the sample and analyze how cracks propagate, how wide or long they are, etc.
Analysis procedure
- In this example, a piece of rock with cracks was scanned using a micro-CT scanner, CT Lab HX.
- The cracks were segmented using gray-level thresholding.
- The width distribution of the segmented cracks was analyzed.
1. CT scan
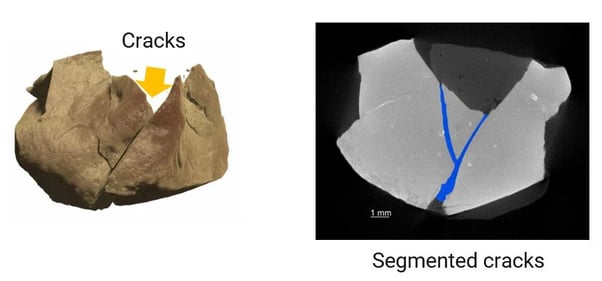
A roughly 1/2" size piece of rock was scanned to produce the 3D grayscale CT image.
2. Image segmentation
The gray level in CT data (right) represents the relative density. The cracks appear black because the air density is lower than that of rock. This crack space was segmented by gray-level thresholding and colored blue.

3. Crack width analysis
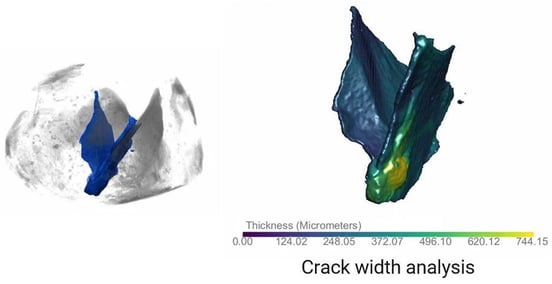
3D rendering of the segmented cracks is highlighted with blue (left).
The crack width was analyzed and color coordinate from purple (0 micron) to yellow (744.15 microns). The width distribution is shown on the right.


