Application Note RACCT9002
About the sample: Polyurethane insulator
Polyurethane-based foam materials are often used in building construction as thermal insulators. The gas bubbles in the foam hinder thermal conduction and provide thermal insulation. The porosity or the volume fraction of the gas bubbles, or cells, is directly related to the thermal conductivity of the foam materials. Thermal conductivity is one of the most important performance parameters of those insulators, and accurate characterization of the porosity and cell morphology is essential for the development and quality control of those building insulation products. X-ray CT (computed tomography) can non-destructively image the cells and cell walls in 3D and is a perfect tool to characterize these foam materials.
Analysis procedure
- In this example, a polyurethane foam (Rmax R-Matte® Plus-3) was scanned using a submicron-resolution CT scanner, nano3DX.
- The CT image was segmented into polyurethane and air using the machine learning segmentation technique.
- The porosity and cell wall thickness distribution were analyzed.
1. CT scan
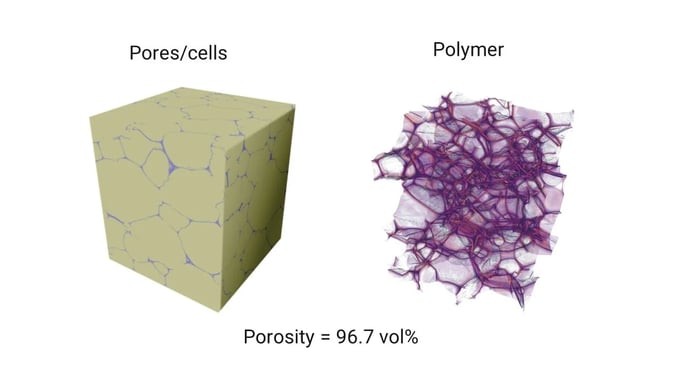
About a few millimeter size piece of polyurethane foam was scanned at 0.7 mm FOV to produce the 3D grayscale CT image. The gray level in CT data (right) represents the relative density. The bright lines are the polyurethane cell walls and the gray areas are the air.

2. Image segmentation
The CT image was segmented into polyurethane (purple) and air (cream).
3. Porosity and wall thickness analysis
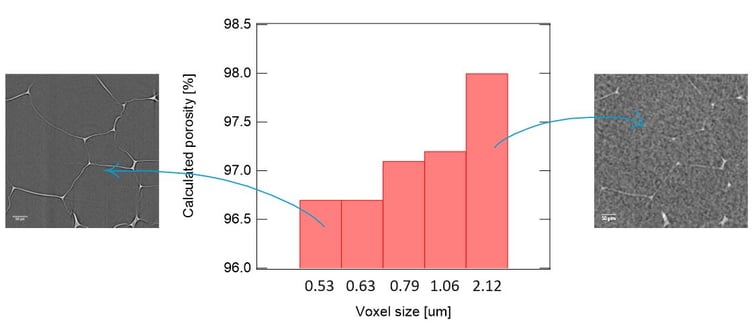
The porosity was calculated as 96.7 vol%. For this analysis, 0.53-micron voxel resolution was used to quantify the volume of polyurethane walls that were 1 to 2 micron thick for the most part.

The voxel size needs to be at least half of the feature size or smaller. The feature size, in this case, is the thickness of the polyurethane walls, and it can be as small as 1 micron. This bar graph shows a comparison of porosities calculated from X-ray CT images collected at different voxel sizes. It shows that the thin walls disappear when the voxel size is large and the porosity is overestimated.
(A. Takase et al., (2018), Microsc. Microanal., 24 (Suppl 2), 546-547)

The segmented polyurethane ROI was converted into a surface mesh and the wall thickness distribution was calculated and color-coded in the 3D rendered view.
The wall thickness was 1 to 3 microns (purple) for the most part. Blue-green lines indicating 10 to 15 microns are seen where two cells connect. Where more than two cells connect, the cell walls are over 20 microns thick (yellow-green).

