Application Note SMX039
Introduction
With the use of Rigaku’s single crystal diffractometers run by CrysAlisPro/AutoChem software, crystal structures can be determined routinely in a matter of minutes. By contrast, absolute structure determination, particularly when only light atoms are present, remains a challenge. Even for some modern diffractometers long, high redundancy measurements are necessary. In the latest generation of Rigaku’s XtaLAB Synergy systems, the combination of the latest ultrabright microfocus PhotonJet X-ray source technologies, and innovative HyPix detectors, allows us to lower the barrier for absolute structure determination. This application note will showcase two examples: naproxen, an important API molecule; and cholestane as an example of a chiral natural product.
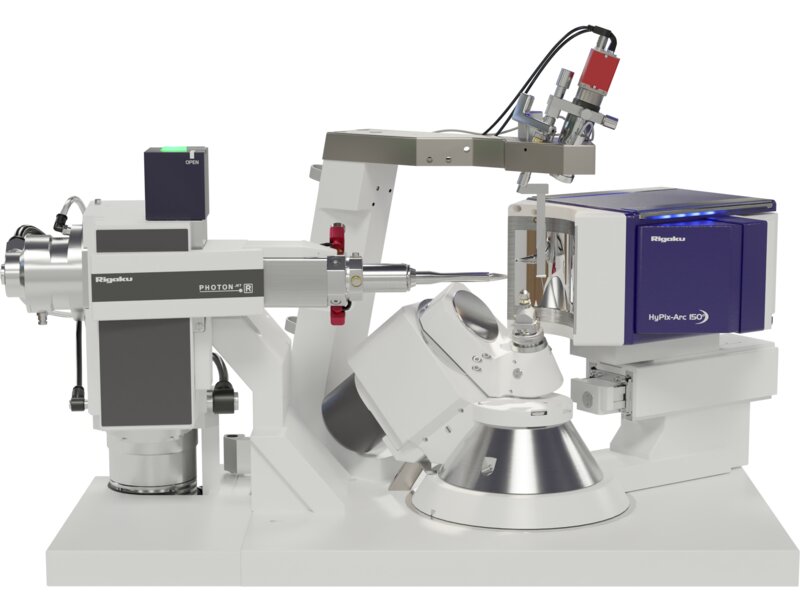 Figure 1: XtaLAB Synergy-R
Case study 1: Naproxen, an example of absolute structure from a sample of unknown chiral purity
In drug development absolute structure determination plays a crucial role both in research and quality assurance. Very often only one of enantiomer is an API, but also there are known cases where the other enantiomer may have unwanted or harmful side-effects. To ensure assignment of the correct hand and an absence of racemic twinning, an s.u. of 0.04 for a Flack parameter or less is required for a statistically meaningful determination of absolute structure. CrysAlisPro pioneered data collection strategies utilizing the kappa goniometer, to orient the sample in the beam to record Friedel pairs in the most similar diffraction conditions (Figure 2). This assists data scaling and, in combination with nearly noise-free HyPix detectors, allows one to collect lower redundancy dataset even for challenging samples.
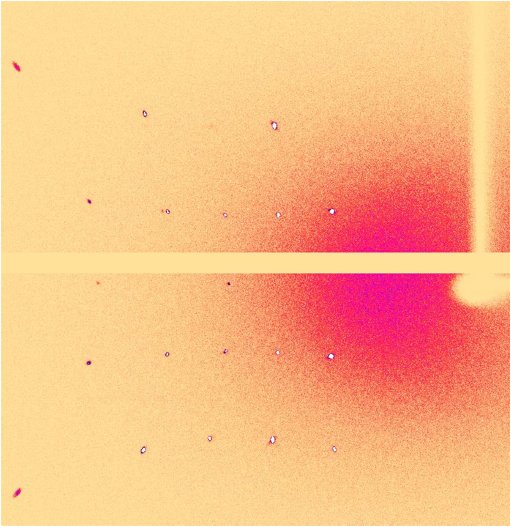
Figure 2: A binned 6° image of frames showing a symmetrical pattern of Friedel pairs reflections. Data collected with help of CrysAlisPro symmetry axis scans option
Experimental
The presented dataset was collected at 100 K on a crystal with a large dimension of around 130 µm with the XtaLAB Synergy-S system in just over 5 hours.
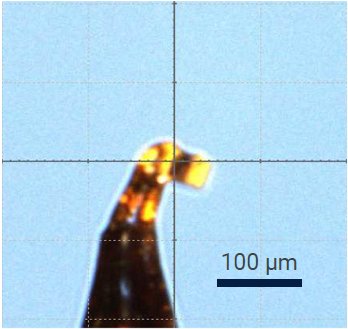
Figure 3: The naproxen crystal.
Results
A high-intensity dataset with average redundancy of just 4.6 (merged in the P2 point group) and Rint of 1.73 % unsurprisingly yielded an exceptional crystal structure refinement with R below 3%.
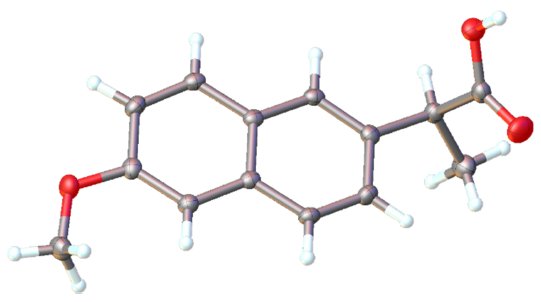
Figure 4: The structure of naproxen obtained.
Thanks to the extreme precision of measurement, the absolute structure was determined with the Hooft parameter, y = 0.03(4) and Parson’s quotient = 0.01(4), satisfying the most rigorous conditions.
Table 1. Selected parameters and results from the naproxen data collection.
| Detector | HyPix-6000HE |
| Detector distance | 37 mm |
| X-ray source | MFST 50 kV, 1 mA |
| Exposure time (min/max) | 1 and 4 seconds |
| Goniometer | UG2 4-circle Kappa |
| Scan width | 0.5° |
| Total frames | 6168 |
| Temperature | 100 K |
| Total time | 5 hours 5 minutes |
| I/σ(I) | 66.29 |
| Redundancy | 4.6 |
| Rint | 1.73% |
| R1 | 2.52% |
| Parson’s quotient | 0.01(4) |
Table 2: Naproxen crystal system, unit cell parameters, crystal dimensions and chemical formula
| Crystal system | Monoclinic, P2₁ | |
| Cell parameters | a b c |
7.72255(12) Å 5.71401(9) Å 13.3628(2) Å |
| β | 93.7564(15)° | |
| Crystal dimensions (mm) | 0.028 x 0.049 x 0.133 | |
| Chemical formula | C₁₄H₁₄O₃ | |
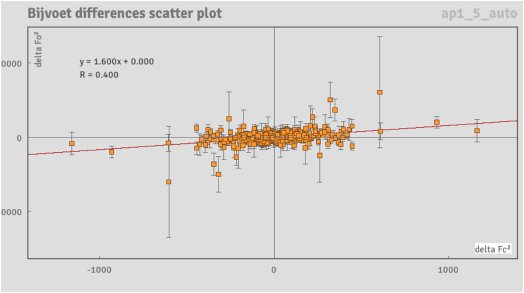
Figure 5: Bijvoet differences scatter plot for the naproxen dataset.
Case study 2: Cholestane, an example of an optically pure sample containing only carbon and hydrogen
Cholestane is a natural biomarker and is the diagenetic product of cholesterol. In many cases, absolute structure determination can be supported by a priori information or additional analysis. If information about the sample’s enantiomeric purity exists, then standard uncertainties up to around 0.1 may be sufficient. In the case of crystal structures containing only carbon and hydrogens atoms, the anomalous effect used to determine the absolute structure is extremely small. To satisfy the condition for an optical pure sample, a data redundancy of tenfold or greater is often required.
Rigaku’s hardware solution to speedily meet this requirement is the HyPix-Arc 150°, a curved Hybrid X-ray Photon Counting detector (Figure 6). This detector is exceptionally efficient in collecting highly redundant data thanks to its clever design and intelligent use of kappa goniometers.
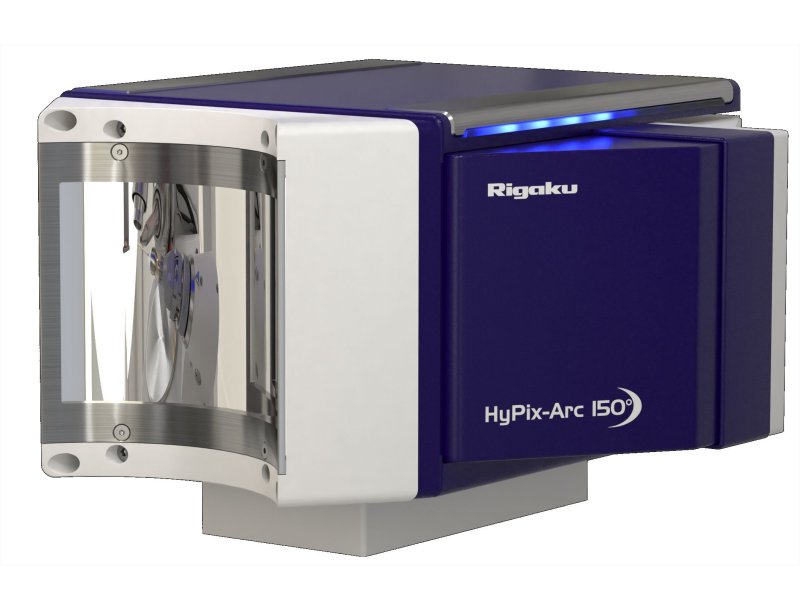
Figure 6: The Hypix-Arc 150°, a curved HPC detector
The ability to record 150 of data degrees from one theta position (Figure 7) provides high redundancy for low-resolution data while the system collects scans to gather full completeness to the required resolution limit. Additionally, HyPix HPC detectors have high dynamic range (31-bit) allowing for data collection with only one exposure time for the entire theta range without worrying about overflows.
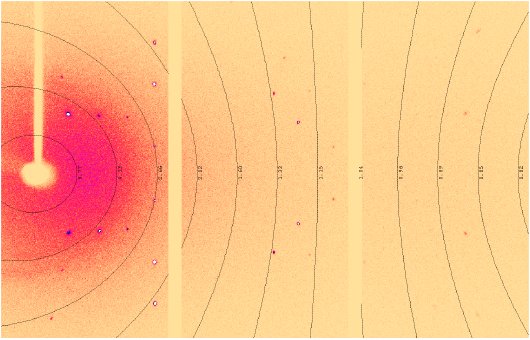
Figure 7: A detector frame from the HyPix-Arc 150° demonstrating wide theta coverage in a single image.
Experimental
The same cholestane crystal (Figure 8) was used in two different experiments, one using the microfocus sealed tube, XtaLAB Synergy-S and the other using the XtaLAB Synergy-DW VHF, which has a rotating anode source. The same HyPix-Arc 150° was used on both instruments. A goal of achieving the same data quality was set.
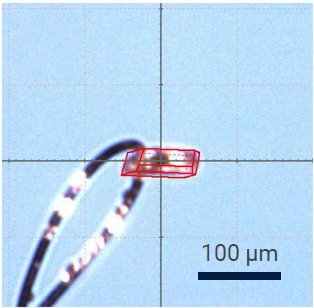
Figure 8: The cholestane crystal selected for measurements with indexed faces overlaid in red.
Results
The increased intensity from the PhotonJet-DW source allowed shortening of the equivalent day-long measurement to just a few hours while still achieving similar absolute structure determination results. This demonstrates the tenfold performance boost a rotating anode system offers, meaning faster experiments are possible without compromising on data quality. Consequently, users are able to work with more challenging samples, and more quickly.
Table 3: Cholestane crystal system, unit cell parameters, crystal dimensions and chemical formula
| Crystal system | Monoclinic, P2₁ | |
| Cell parameters | a b c |
11.38497(4) Å 10.90340(4) Å 19.50978(8) Å |
| β | 104.2889(4)° | |
| Crystal dimensions (mm) | 0.03 x 0.083 x 0.096 | |
| Chemical formula | C₂₇H₄₈ | |
Table 4: Selected parameters and results from the cholestane data collections
| Detector | HyPix-Arc 150° | |
| Detector distance | 39 mm | |
| X-ray source | MFST 50 kV x 1 mA |
MFRAG 40 kV x 30 mA |
| Exposure time (min/max) | 5 s | 0.53 s |
| Goniometer | UG2 4-circle Kappa | |
| Scan width | 0.5 ° | |
| Total frames | 16031 | 15204 |
| Temperature | 100 K | |
| Total time | 22 h 44 min | 2 h 46 min |
| I/σ(I) | 78.7 | 89.51 |
| Redundancy | 17.9 | 16.8 |
| Rint | 3.35% | 2.78% |
| R₁ | 2.83% | 3.94% |
| Parson’s quotient | -0.07(10) | -0.10(11) |
| Hooft parameter, y | -0.07(8) | -0.07(9) |
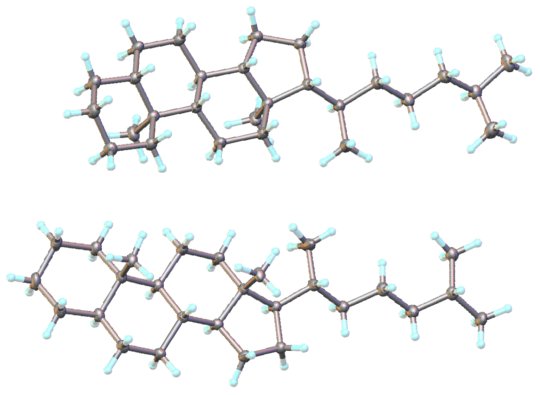
Figure 9: The determined structure of cholestane.
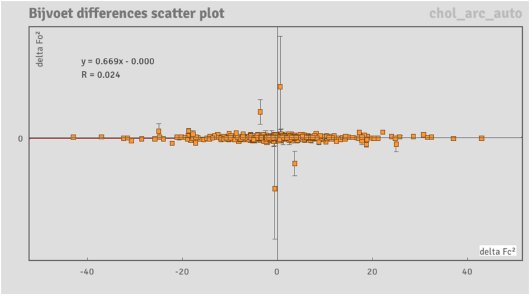
Figure 10: A Bijvoet differences scatter plot from the cholestane data collection
Conclusions
Absolute structure determination of crystal structures containing only light atoms is challenging, even for modern diffractometers. Intense, very stable beams combined with intelligent software and hardware can improve scaling to solve this problem. XtaLAB Synergy systems offer HyPix technology, a direct-detection hybrid photon counting detector, alongside high intensity PhotonJet X-ray sources with excellent stability. Rigaku’s core technologies, developed with both protein (SAD phasing) and small molecule (absolute structure determination) in mind, work to your advantage when it comes to observing very weak anomalous signal. The cholestane examples show that absolute structure can be determined even for compounds that contain only carbon and hydrogen.

