Application Note SMX019
Introduction
Crystals containing long unit cell axes are often challenging samples requiring extended data collection strategies in order to collect good, publication-quality data. This is mainly due to the overlap of reflections, which complicates data processing and therefore requires longer crystal-to-detector distances to minimize overlap. Long unit cell axes often arise when the contents of the cell are large; e.g. proteins, macrocyclic host-guest complexes, or when the Z’ number for a small molecule is high. Overlapping of reflections can also occur in non-merohedrally twinned samples, where the multiple components have intersecting lattices. Here, we show the advantages of using a Hybrid Photon Counting (HPC) detector to overcome the challenges of overlapping reflections.
HyPix-6000HE
Unlike scintillator-based detectors, HPC detectors count individual X-ray photons. By design, the charge cloud from an individual photon stays within the pixel it strikes. As a result, there is virtually no diffusion of the point spread function and very low background noise. The HyPix-6000HE detector from Rigaku is a new HPC detector that has these features as well as small pixels (size: 100 μm × 100 μm), making it possible to resolve reflections from samples with long unit cell axes and/or twinned crystals at short sample-to-detector distances.
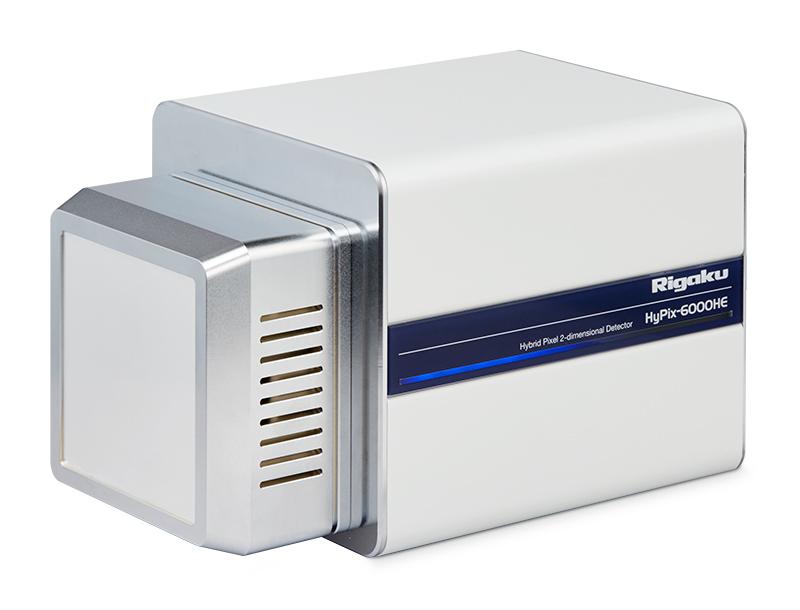
Figure 1: The HyPix-6000HE detector.
Crystal sample description
Polymorph IV of o-toluic acid is formed through a temperature-dependent phase transition from Polymorph I at 90 K. It crystallizes with a long unit cell axis of ca. 68 Å and was chosen to highlight a few features of the HyPix-6000HE detector on a XtaLAB Synergy-S instrument. The particular crystal chosen was also non-merohedrally twinned.
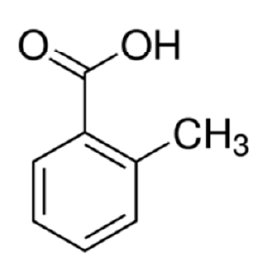
Figure 2: o-Toluic acid (2-methyl benzoic acid).
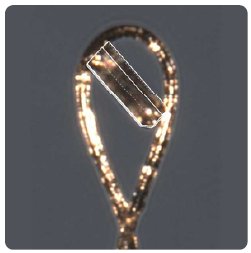
Figure 3: Crystal sample (0.213 × 0.078 × 0.213 mm).
Table 1: Unit cell parameters of o-toluic acid
| Chemical formula | C₈H₈O₂ |
| Space group | P2₁/n |
| a (Å), α (°) | 7.5913(1), 90 |
| b (Å), β (°) | 68.432(2), 94.405(2) |
| c (Å), γ (°) | 7.7149(2), 90 |
| V (Å3) / Z / Z’ | 3995.9(2) / 24 / 6 |
CrysAlisPro and Ewald Explorer
Using the CrysAlisPro software package, the data could be displayed using the Ewald Explorer tool. The automatic twin-finding option was used to identify the two twin components, which are related to each other by a 180° rotation around the c-axis.
Data collection strategies
Two data collections were conducted, one with Cu radiation and one with Mo radiation, both at sufficiently close crystal-to-detector distances (30 mm - Cu and 50 mm - Mo) to test the spatial resolution that can be achieved using the HyPix-6000HE detector. As the crystal was twinned, a data collection strategy was planned with four-fold redundancy.
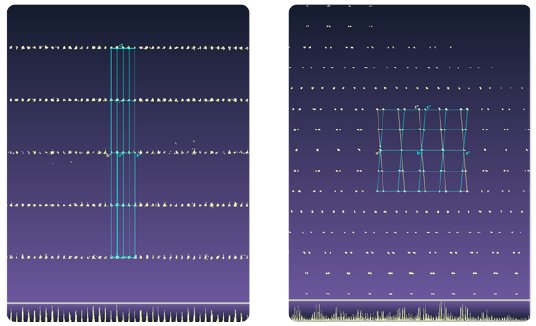
Figure 4: View along a* (left) and b* (right) to illustrate the long unit cell axis and twinning respectively.
Copper data collection
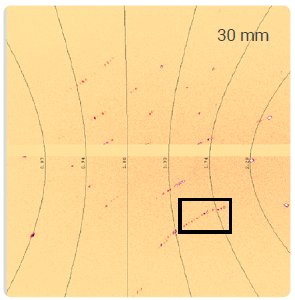
Figure 5: A selected frame from the high-angle Cu dataset.
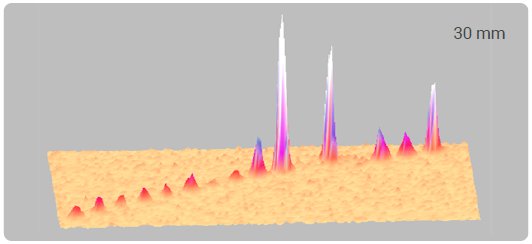
The figure above illustrates the excellent spatial resolution achieved for a particular set of high-angle reflections shown in Figure 5. The low background noise makes it possible to detect the weaker reflections with ease.
Molybdenum data collection
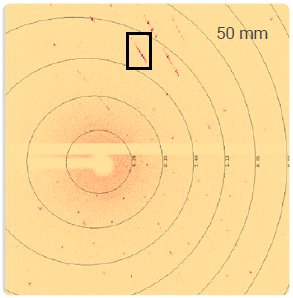
Figure 6: Diffraction image from the Mo dataset.
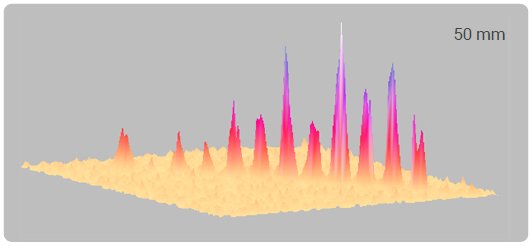
As Mo radiation has a much shorter wavelength than Cu, it is necessary to increase the crystal-to-detector distance. No excessive overlaps were observed, resulting in excellent twin reduction statistics and final refinement values.
Results and conclusions
Table 2 highlights the results from the two data collections performed. The same data reduction parameters were used and both datasets were finalized using empirical absorption correction methods. Both datasets were processed with CrysAlisPro Version 171.39.
Table 2: Data reduction and refinement statistics for the Cu and Mo datasets
| Cu dataset (30 mm) | Mo dataset (50 mm) | |||
| Wavelength (Å) | 1.54184 | 0.71073 | ||
| Total frames | 3710 | 1612 | ||
| Unique reflections | 7576 | 8606 | ||
| Overlap statistics (isolated / overlapped) | 81% / 19% | 80% / 20% | ||
| Completeness | 100% (∞ → 0.83) | 100% (∞ → 0.83) | ||
| Average I/σ (HKLF5) | 25.54 | 17.63 | ||
| Redundancy | 4.0 | 3.7 | ||
| Rint | HKLF4: 0.043 | HKLF5: 0.016 | HKLF4: 0.051 | HKLF5: 0.041 |
| R₁ | HKLF4: 4.55% | HKLF5: 4.14% | HKLF4: 5.73% | HKLF5: 5.18% |
| Refined BASF values | 0.341(2) | 0.352(2) | ||
| GooF | 1.127 | 1.098 | ||
The results show that the HyPix-6000HE is able to resolve reflections very well, even at close crystal-to-detector distances, and produce excellent crystal structures in conjunction with the software package CrysAlisPro. The twin ratios refined to very similar values for the Cu and Mo datasets (see BASF values).
The most notable result here is that a good structural model for a crystal with a long unit axis cell (close to 70 Å) was refined from the Mo dataset using a crystal-to-detector distance of 50 mm despite traditional wisdom suggesting that 70 mm would have been more appropriate. In conclusion, we have shown that the zero-point spread function and small pixel size of the HyPix-6000HE detector is a great feature for small molecule crystallographers who deal with long unit cell samples and twinned crystals where the overlap is very small. This is particularly applicable when using shorter wavelengths.

