Application Note PX031
Introduction
When protein microcrystals are too small for X-ray crystallography (< 1 μm), microcrystal electron diffraction (microED) is a viable alternative. Success requires meticulous preparation flash-cooling crystals on 3 mm transmission electron microscope (TEM) grids with the thinnest layer of liquid to keep the crystals hydrated while not blocking the electron beam. The protocols involve many rounds of blotting grids for various times followed by plunge cooling in liquid ethane. Even when the perfect blot and freeze are achieved, it may turn out that the crystals are too thick for microED and require thinning via a cryo-focused ion beam (FIB) mill. Since we offer a platform for fast and easy microED data collection and processing with our dedicated electron diffractometer, the XtaLAB Synergy-ED, that has been proven on hundreds of small molecules, we were interested in a simpler preparation method for protein microED. Here, we demonstrate a relatively quick and easy way of preparing protein crystals for microED data collection on our XtaLAB Synergy-ED.
Experimental overview
Lysozyme from chicken egg white (Sigma L6876) was suspended in 0.1 M NaOAc pH 4.4 to make a 40 mg/mL solution. Cryoprotected tetragonal crystals of lysozyme were grown at 18˚C from sitting drops consisting of 2 μL of lysozyme plus 2 μL of crystallization solution [7% NaCl, 0.1 M NaOAc pH 4.4, 18% ethylene glycol] over a well containing 400 μL of crystallization solution.
Mirosław Gilski from Adam Mickiewicz University in Poznań provided us with the crambin sample. Crambin was obtained from Dr. Julian Chen of the Bioscience Division, Protein Crystallography Station, Los Alamos National Laboratory. The protein was extracted from Abyssinian cabbage seeds (Crambe abyssinica), and it can be transported as a suspension because it is insoluble in water.
XtaLAB Synergy-ED specifications are listed in Table 1 and the instrument has been described extensively¹,². Data collection and processing was performed using CrysAlisPro, and structure solution was performed using CCP4i2³. Data collection temperature was 100 K.
Table 1: XtaLAB Synergy-ED specifications.
| Electron gun | LaB₆ |
| Column & optics | JEOL JEM-2300ED |
| Operating voltage | 200 kV |
| Wavelength | 0.0251 Å |
| Specimen holder | Gatan Elsa 698 |
| Detector | Hybrid photon counting Rigaku HyPix-ED |
| Active area Frame rate Pixel size Cooling |
38.5 x 77.5 mm 100 Hz 100 µm air-cooled |
Results
To attempt microED with lysozyme, we chose to start with standard ( i.e., X-ray size) crystals and break them down mechanically. Typically, a ~0.5 mm crystal was selected within a hanging drop and then crushed with a micro-tool to create a microcrystal cloud (Figure 1). Then, 5 μL of mother liquor was added to the drop, pipetted up and down to mix, and transferred to a microcentrifuge tube. This step was repeated 3 more times to end up with a total volume of 20 μL in the tube.

Figure 1: Example of lysozyme crystal selected for microED. A large ~0.5 mm crystal (left) was manually crushed with a micro-tool (Hampton Research HR4-817) to produce a shower of microcrystals (right).
We then prepared TEM grids of the microcrystals (Figure 2). Each Cu Quantifoil grid was glow discharged for 60 seconds (30 seconds on each side) to make the surfaces of the grid hydrophilic. Then, a grid was picked up with lockable tweezers and placed in the plunger arm of MiTeGen’s manual plunge cooler. A volume of 2.5 μL of slurry was pipetted on each side of the grid and allowed to sit for 30 to 60 seconds. Then, the grid was blotted on both sides by gently squeezing it with a folded piece of Whatman filter paper. The blotting times were critical:
- Too short and the liquid layer was too thick for the electron beam to penetrate it.
- Too long and the crystals were dried out and did not diffract.
Ultimately, we found that between 15 to 20 seconds produced the best results. Immediately, at the end of the blot, the grid was plunged into a foam dewar filled with liquid nitrogen. [Note: The plunger cooler is designed and supplied with an ethane cryostat, a special dewar setup that allows one to liquify ethane gas surrounded by a bath of liquid nitrogen. The ethane plunge cool is critical for preventing ice when freezing grids for cryoEM imaging, but we reasoned not as critical for microED.]

Figure 2: The grid preparation process. (A) A 3 mm Cu Quantifoil grid (Ted Pella 658-200-CU) is placed in a (B) PELCO EasiGlow for 60 seconds of glow discharging. (C) The grid is placed in the tweezers of a manual plunge cooler (MiTeGen ML-EMCPTCCS-01) and 2.5 μL of protein slurry is pipetted on to both sides. (D) After 30 to 60 seconds, both sides of the grid are simultaneously blotted by hand with a folded piece of Whatman filter paper for 15-20 seconds. (E) Then, the grid is quickly plunged into a dewar filled to the brim with liquid N₂.
Once grids were flash-cooled, they were kept under liquid nitrogen. First, they were transferred to a grid box that holds 4 grids. Then, the grid box was transferred into the liquid-nitrogen-filled cryotransfer station for the Gatan Elsa 698. A single grid was placed in the tip of the Elsa 698 (set to hold at 100 K), a clip ring inserted, and the shutter closed over the grid. Then, the Elsa was inserted into the XtaLAB Synergy-ED.
Using the CrysAlisPro-ED interface, individual lysozyme crystals were located, centered, screened, and collected. Three crystals and representative diffraction images are shown in Figure 3. In the visual images, note the lack of liquid and the clarity of the holes and the crystals. Also, note that the crystals are or have regions that are transparent (i.e., ~200 nm thick). This confirmed that crystals of suitable size for microED could be located without the use of a FIB mill. In the diffraction images, note that a virtual crystal-to-detector distance of 1.5 m was used to achieve separation between neighboring spots on the longest lattice edge.
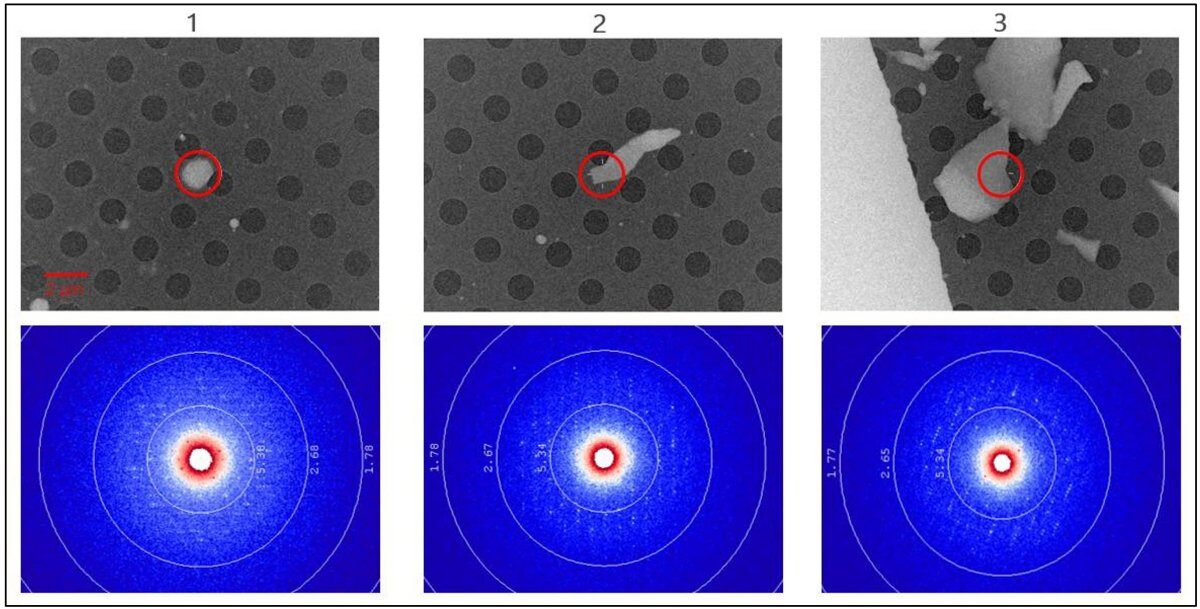
Figure 3: Visual (defocused diffraction) images of three lysozyme crystals (top) and representative diffraction images (bottom). The 2-μm red circle (top) represents the size of the selected area (SA) aperture below the crystal. Only the diffraction from what is inside the SA aperture is recorded on the HyPix-ED detector.
Data sets of up to 90° in tilt were collected in 5.5 min or less and data processing statistics are shown in Table 2. Each data set had a usable resolution close to 2 Å and was at least 89% complete. We used the model from PDB id 2LYZ (with solvent, ligands, and alternate conformations removed) in a Phaser⁴ molecular replacement job to solve each structure. The structures were finished with several rounds of manual adjustment in Coot⁵ and refinement with Refmac⁶. Each produced a good model with reasonable stereochemistry and R factors (Figure 4).
An even simpler preparation method was attempted with a slurry of crambin crystals. A volume of 2.5 μL of slurry was pipetted on the top of a lacey carbon grid held by locking tweezers. Then, the grid was blotted from underneath with Whatman filter paper while monitoring the drying process through a stereoscope. Once the grid seemed dry enough, it was hand plunged into a nearby dewar filled with liquid nitrogen.
Table 2: Lysozyme microED data collection, processing, and structure solution statistics.
| 1 | 2 | 3 | |
| Tilt range | 80° | 90° | 65° |
| Rotation per image | 0.2° | 0.2° | 0.2° |
| Detector distance | 1.535 m | 1.535 m | 1.535 m |
| Total exposure time | 5 m 20 s | 4 m 30 s | 2 m 10 s |
| Unit cell | 80.0, 80.0, 37.2 Å | 80.4, 80.4, 37.3 Å | 79.6, 79.6, 37.5 Å |
| Space group | P4₃2₁2 | P4₃2₁2 | P4₃2₁2 |
| Resolution range (highest shell) |
22.2 – 2.0 (2.07 – 2.0) Å |
21.0 – 2.0 (2.07 – 2.0) Å |
22.5 – 2.2 (2.28 – 2.2) Å |
| Completeness (highest shell) | 89.0% (88.1%) | 98.3% (98.1%) | 92.4% (93.0%) |
| Redundancy (highest shell) | 5.5 (5.4) | 7.2 (7.1) | 5.4 (5.5) |
| Mean I/σI (highest shell) | 3.9 (1.4) | 3.5 (1.3) | 4.6 (1.5) |
| Rint (highest shell) | 33.8% (78.1%) | 38.4% (80.0%) | 30.1% (71.4%) |
| CC1/2 (highest shell) | 0.96 (0.44) | 0.97 (0.49) | 0.96 (0.46) |
| R | 24.1% | 22.3% | 21.6% |
| Rfree | 28.2% | 28.5% | 29.8% |

Figure 4: Lysozyme structures in the vicinity of Trp111. The 2Fo-Fc maps (blue) are contoured at 2 rmsd and the Fo-Fc maps (red/negative and green/positive) are contoured at 3 rmsd.
Using the CrysAlisPro-ED interface, individual crambin crystals were located, centered, screened, and collected. A single crystal and representative diffraction image are shown in Figure 5. In the visual image, note that the crystals are very large, but have regions that are transparent (i.e., ~200 nm thick). In the diffraction image, note that crambin diffracts to nearly 1 Å.

Figure 5: MicroED with crambin. Visual (defocused diffraction) images of a crambin crystal (left) and a representative diffraction image (middle). The 2-μm red circle (left) represents the size of the selected area (SA) aperture below the crystal. The right panel shows 2Fo-Fc maps contoured at both 4.5 and 1 rmsd (magenta and blue, respectively) and the Fo-Fc maps (red/negative and green/positive) are contoured at 3 rmsd.
Table 3: Crambin microED data collection, processing, and structure solution statistics.
| 1a | 1b | Merged | |
| Tilt range | 85° | 60° | |
| Rotation per image | 0.2° | 0.2° | |
| Detector distance | 1 m | 1 m | |
| Total exposure time | 1 m 30 s | 1 m 0 s | |
| Unit cell | 22.7, 18.8, 41.5 Å 90, 90.4, 90 ° | ||
| Space group | P2₁ | P2₁ | P2₁ |
| Resolution range (highest shell) |
22.7 – 1.07 (1.11 – 1.07) Å |
22.7 – 1.07 (1.11 – 1.07) Å |
22.7 – 1.07 (1.11 – 1.07) Å |
| Completeness (highest shell) | 58.2% (53.2%) | 37.7% (31.9%) | 71.2% (64.9%) |
| Redundancy (highest shell) | 2.9 (2.7) | 2.8 (2.7) | 3.9 (3.6) |
| Mean I/σI (highest shell) | 4.7 (1.9) | 3.2 (1.0) | 4.9 (1.6) |
| Rint (highest shell) | 14.9% (50.6%) | 15.6% (70.0%) | 16.5% (62.6%) |
| CC1/2 (highest shell) | 0.99 (0.43) | 0.99 (0.36) | 0.99 (0.47) |
| R | 20.5% | ||
| Rfree | 22.5% |
Two data sets were collected on the same crystal and then both data sets were merged to improve the overall completeness. Data processing statistics are shown in Table 3. The result was a data set to 1.07 Å that was 71% complete. The model from PDB id 3NIR (with solvent, ligands, and alternate conformations removed) was used in a Phaser molecular replacement job to solve the structure. The structure was finished with several rounds of manual adjustment in Coot and refinement with Refmac. The model had good stereochemistry and R factors (Figure 5).
Conclusion
Two simpler grid preparation methods for protein microED that do not require a cryo-FIB and/or liquid ethane are a success. In the first, microcrystals are generated by crushing larger crystals while only liquid nitrogen is used for flash-cooling in a cryo-plunge device. In the second, a slurry of crystals is hand-plunged into liquid nitrogen. In both methods, the most critical step is the blotting of the excess liquid immediately prior to flash-cooling. This is a trial-and-error process and most times many grids need to be screened to find suitable crystals for data collection. The XtaLAB Synergy-ED makes the screening, collecting, and processing the easiest part of the process.
References
- Ito, S. et al (2021) CrystEngComm, 23(48), 8622–8630.
- Truong, K-N. et al (2023) Symmetry, 15(8), 1555.
- Agirre, J. et al. (2023) Acta Cryst. D79, 449-461.
- McCoy, A.J. et al. (2007) J. Appl. Cryst. 40, 658-674.
- Emsley P., Lohkamp B., Scott W.G., Cowtan K. (2010). Acta Cryst. D66, 486-501.
- Murshudov G.N., et al. (2011). Acta Cryst. D67, 355-367.
