Application Note WDXRF1066
Introduction
Nickel is one of the most important base metals for modern infrastructure. Over 60 percent of world nickel production (nickel metal based) is used for the making of stainless steel. There are mainly two types of resources for nickel mining – sulfide and laterite (oxide) ores. More than 70 percent of world nickel resources on land are found in laterite ores.
Nickel laterite ore deposits are formed by weathering of ultramafic rocks in tropical to subtropical regions. Stratigraphic rock facies of nickel laterite deposit are typically layered upward as follows: serpentinized peridotite—saprolite—transitional rock—limonite—ferricrete. These rock facies are also gradually changed in mineral assemblages and chemical compositions. Nickel is extracted from ores mined from saprolite to limonite layers.
X-ray fluorescence spectrometry (XRF) is a well-known analytical method to determine chemical composition in materials with high accuracy and simple sample preparation. Therefore, XRF technique is used for process and quality control in many industries. Sample preparation by fusion bead method allows high accuracy analysis of geological samples, because the method completely eliminates sample heterogeneity such as grain size and mineralogical effects, caused by various rock-forming minerals in geological samples.
For the analysis of nickel laterites by XRF, high spectral resolution is required to detect trace amount of cobalt, since the wavelength are very close between iron and cobalt so that a large iron peak overlaps to the small cobalt peak in the spectrum. In addition, high sensitivity is required for the analysis of light elements such as magnesium. Wavelength dispersive XRF (WDXRF) can meet both of these requirements.
This note demonstrates advanced methods to determine wide range chemical composition of rocks in nickel laterite deposits by fusion method.
Instrument
The ZSX Primus III NEXT is a floor-standing sequential wavelength dispersive X-ray fluorescence (WDXRF) spectrometer, which has advantages in high spectral resolution and high sensitivity for light elements. The instrument is designed to provide reliable analysis results and its flexibility provides multi-purpose availability to wide range applications.
The ZSX Primus III NEXT is equipped with a 3 kW Rh target X-ray tube. Analyzing crystals (up to 10 crystals) can cover analysis from beryllium to uranium.
The instrument also has a built-in intelligent automatic sample changer (ASC). The ASC is upgradable to 48 samples for high demand processes.
The ZSX Primus III NEXT has a unique optical configuration designed to minimize errors caused by surface condition of samples. Therefore, even fused beads which may have curved surfaces due to slight deformation of crucible base caused by long term wear can be measured with high precision and accuracy. The software is designed such that even inexperienced users can easily operate the system. In particular, the flow bar scheme fully supports the user for easy set-up of quantitative applications.
Standard and sample preparation
The calibration standard samples used in this demonstration are commercially available 25 certified reference materials (CRMs) supplied from EURONORM, Geostats Pty Ltd., Ore Research and Exploration Pty Ltd., Instituto de Tecnologia August Kekule Ltda., Mintek and Japan Iron and Steel Federation. These standards are composed of typical nickel laterites including limonite through saprolite ores. Additionally, iron ores (limonite) and ultramafic rocks (serpentinite and pyroxinite) were added to expand calibration range for some elements. These reference samples can cover rocks in the entire stratigraphic profile in typical laterite deposits. Concentration range of nickel and cobalt, which are target metals to determine ore grade, in these CRMs are from 0.003 to 4.1 and 0.001 to 0.21 mass%. Iron and magnesium content, which are indicative factor for determination of nickel extraction processes, ranges from 2.9 to 57 mass%, 0.11 to 25 mass%, respectively.
The well-dried (2 hours at 105°C) samples were fused with Lithium tetraborate (Li₂B₄O₇) as flux with sample to flux ratio 1:10. Duplicate beads were made for each CRM.
Although laterite ores are commonly highly hydroscopic, sample calcination before making fused beads is not required since loss on ignition (LOI) and gain on ignition (GOI) during fusion can be corrected by using theoretical alphas considering LOI and GOI when setting up calibrations. As dilution (sample to flux) ratio can be also corrected together with matrix effects, it is not necessary to weigh sample and flux exactly. By specifying the actual measured sample and flux weights, the software is able to accurately correct for differences in dilution ratio.
Measurement and calibration
ZSX Primus III NEXT was used for the measurement of Ni, Co, Cu, Zn, Cr, Fe, Na, Mg, Si, Al, P, S, Ca, K, Ti, Mn and V element lines. Measurements were performed using standard analyzing crystals installed in ZSX Primus III NEXT except for P, S and Co. Optional Ge crystal was used for P and S measurements. LiF(220), which is an optionally available high resolution crystal, was used for Co-Kα line measurement to detect without overlapping of Fe-Kβ1.
Calibration for all components uses the following equation:
$W_i = (AI_i+B)\cdot(1+\sum{a_jW_j})$
$I_R = I_{Fe}/I_{scat}$
$a_j$: theoretical alpha of element j
$W_j$: weight fraction of element j
$I_i$: intensity of element i
$A, B$: contant
Matrix correction coefficients (alpha) applied to the calibrations are theoretically calculated by the built-in fundamental parameter software.
Results
Calibration curves for NiO, Co₂O₃, Fe₂O₃, MgO, Al₂O₃, CaO, CuO and ZnO are shown in Figure 1. Aluminum, calcium and magnesium are elements of interest as well as target metals. It is preferred that the content of these elements are low, since they cause excessive consumption of sulfuric acid during the metal extraction process when the laterite ore is leached. Copper and zinc are harmful to nickel and cobalt refining.
Typical calibration accuracies for all measured elements are listed in Table 1.
The accuracy of calibration is calculated by the following the equation:
$Accuracy = \sqrt{ \frac{\sum_i{(C_i-\hat{C}_i)^2}}{n-m} }$
$C_i$: calculated value of standard sample
$\hat{C}_i$: reference value of standard sample
n : number of standard samples.
m: degree of freedom (linear 2, quad. 3)
Table 1: Accuracy of calibration curves (unit: mass%)
| Component | Concentration range | Typical accuracy of calibration |
| NiO | 0.004 - 5.1 | 0.049 |
| Co₂O₃ | 0.002 - 0.29 | 0.0037 |
| Fe₂O₃ | 4.2 - 81 | 0.30 |
| MgO | 0.2 - 42 | 0.079 |
| Na₂O | 0.002 - 0.67 | 0.023 |
| Al₂O₃ | 1.1 - 9.8 | 0.089 |
| SiO₂ | 4.9 - 71 | 0.18 |
| P₂O₅ | 0.004 - 0.095 | 0.0021 |
| SO₃ | 0.0002 - 7.4 | 0.014 |
| K₂O | 0.007 - 0.33 | 0.0034 |
| CaO | 0.02 - 12 | 0.019 |
| TiO₂ | 0.01 - 0.35 | 0.0049 |
| V₂O₅ | 0.003 - 0.079 | 0.0011 |
| Cr₂O₃ | 0.004 - 5.5 | 0.040 |
| MnO | 0.06 - 2.3 | 0.012 |
| CuO | 0.006 - 0.56 | 0.0077 |
| ZnO | 0.006 - 0.16 | 0.0016 |
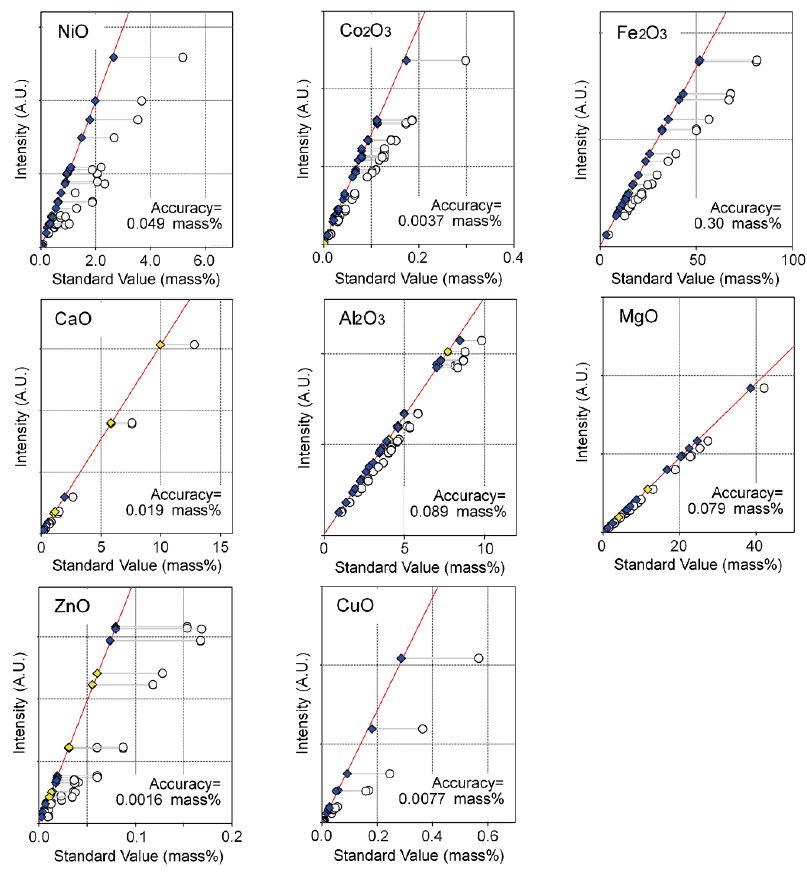
Figure 1: Calibration curves of representative elements in nickel laterite ores. Calibration curves are corrected by using theoretical alpha coefficients calculated by FP method. All components are represented in oxide form since all elements are oxidized during fusion process.
Blue: Corrected (certified), Yellow: Corrected (uncertified), White: Uncorrected.
Two ore CRMs (saprolite and limonite) were measured as unknown samples 20 times to assess the instrument’s precision. Results are summarized in Table 3 and 4.
Table 3: Result of precision test for saprolite ore (unit:mass%)
| Element | Certified value | Average of 20 measurements | Std. dev. | RSD% |
| NiO | 2.67 | 2.69 | 0.002 | 0.085 |
| Co₂O₃ | 0.0597 | 0.0588 | 0.001 | 1.7 |
| Fe₂O₃ | 16.42 | 16.42 | 0.01 | 0.063 |
| MgO | 22.77 | 22.62 | 0.04 | 0.18 |
| Na₂O | 0.027 | 0.041 | 0.006 | 14 |
| Al₂O₃ | 2.73 | 2.71 | 0.008 | 0.30 |
| SiO₂ | 42.90 | 42.48 | 0.03 | 0.061 |
| P₂O₅ | - | 0.0043 | 0.0004 | 8.9 |
| SO₃ | - | 0.0054 | 0.0008 | 14 |
| K₂O | - | 0.011 | 0.0003 | 2.9 |
| CaO | 0.32 | 0.31 | 0.0009 | 0.28 |
| TiO₂ | 0.033 | 0.036 | 0.002 | 6.1 |
| V₂O₅ | - | 0.0099 | 0.0007 | 7.2 |
| Cr₂O₃ | 0.814 | 0.813 | 0.003 | 0.34 |
| MnO | 0.262 | 0.265 | 0.001 | 0.40 |
| CuO | 0.0051 | 0.0026 | 0.0001 | 4.1 |
| ZnO | 0.0229 | 0.0212 | 0.0003 | 1.4 |
Table 4: Result of precision test for limonite ore (unit: mass%)
| Element | Certified value | Average of 20 measurements | Std. dev. | RSD% |
| NiO | 1.88 | 1.86 | 0.003 | 0.15 |
| Co₂O₃ | 0.11 | 0.11 | 0.001 | 1.2 |
| Fe₂O₃ | 67.86 | 66.17 | 0.04 | 0.058 |
| MgO | 3.08 | 3.09 | 0.02 | 0.67 |
| Na₂O | - | 0.037 | 0.004 | 12 |
| Al₂O₃ | 3.70 | 3.59 | 0.01 | 0.29 |
| SiO₂ | 6.76 | 6.77 | 0.01 | 0.19 |
| P₂O₅ | 0.016 | 0.015 | 0.0006 | 4.1 |
| SO3 | 0.47 | 0.47 | 0.001 | 0.29 |
| K₂O | - | 0.014 | 0.0004 | 3.2 |
| CaO | 0.14 | 0.15 | 0.0006 | 0.36 |
| TiO₂ | 0.025 | 0.019 | 0.001 | 7.4 |
| V₂O₅ | - | 0.026 | 0.0009 | 3.3 |
| Cr₂O₃ | 2.69 | 2.74 | 0.005 | 0.18 |
| MnO | 0.75 | 0.76 | 0.002 | 0.22 |
| CuO | - | 0.0022 | 0.0002 | 7.1 |
| ZnO | - | 0.060 | 0.0004 | 0.68 |
Conclusions
This application note demonstrates that it is possible to accurately determine chemical composition of nickel laterite ores and related rocks with wide concentration ranges from ultramafic bedrock to surface rock by the fusion method of X-ray fluorescence spectrometry.
