Application Note WDXRF1047
Introduction
Iron is one of the most important materials in industry and technology. Recent rapid growth of developing countries drives increasing iron consumption in the world, so that the amount of production and price of iron ore are also increasing. Highly accurate determination of total iron concentration in the natural and processed iron ores is a strong demand of iron ore suppliers and producers. They also require the cost-efficiency in analysis because the traditional wet chemistry technique of total iron analysis is time consuming and a high cost method.
This note demonstrates an improved method to determine total iron in the natural and processed iron ores using the pressed powder technique which is cost-effective, rapid and uses a simple sample preparation procedure. This has been achieved by Rigaku’s advanced FP technology.
Instrument
The Supermini200 is a benchtop sequential wavelength dispersive X-ray fluorescence (WDXRF) spectrometer. The characteristics of a WDXRF instrument are high sensitivity in light element analysis and high spectral resolution. The Supermini200 is designed to minimize the complexity of installation by eliminating the need for cooling water, the use of standard power and the use of a small benchtop foot-print. The spectrometer is also equipped with an air-cooled 200 W X-ray tube and up to three analyzing crystals, in which elements from oxygen to uranium can be analyzed just like conventional floor-standing type WDXRF instruments.
The operation software provides users with a high degree of flexibility and the availability of various applications from solid samples to liquid samples.
The software includes the Compton scattering ratio alphas determined by the fundamental parameter (FP) method and this gives improved results in the determination of total iron in the natural and processed iron ores compared to the results from the conventional simple Compton scattering ratio method.
Standard and sample preparation
The iron ore standard samples used for calibrations were commercially available certified reference materials (CRMs) supplied from Japan Iron and Steel Federation (JISF) and Bureau of Analysed Samples Ltd (BAS). These standards are natural and processed iron ores composed of hematite ore, magnetite ore, iron sand, sintered ores and pellets.
Pelletizing method for powder sample is a most common technique in XRF spectrometry. The method does not require any expensive flux and fusion machine, and also any special skill or experience to operators. The well-dried (2 hours at 105°C) samples were ground in a tungsten carbide container and then pressed in a sample cup under the pressure of 250 kN. No binder was added because binder increases errors in the calibration method. Polymer thin film wraps the pressed pellet to minimize any contamination caused by unexpected grain scattering.
Measurement and calibration
Measurements were performed on the Supermini200 with 200 W Pd target X-ray tube for the peak intensity of element line of Fe, Si, Al, P, Mg, S, Ca, K, Ti, Mn, V and Pd-Kα Compton scattering. The analysis atmosphere was run in vacuum and the excitation energy used was set at 50 kV and 4 mA.
A primary beam filter was used for measurement of K-Kα line to prevent interference from the line of target material in tube. Counting time was Fe 40s, Si 10s, Al 20s, P 20s, Mg 20s, S, 20s, Ca 10s, K 20s, Ti 20s, Mn 10s, V 20s and Compton 60s. Pressed pellets were covered by polymer thin film (4 μm Prolene® film) before the samples were set into sample holders.
Geological samples such as rocks and minerals have complex matrices and it requires correction for those matrix effects in the calibration. For the matrix correction of total iron calibration in pressed iron ore, Compton scattering line has conventionally been used as an internal standard (Compton ratio method). However, the correction of this method is not enough to obtain highly accurate results such as for the total iron determination. Improved Compton ratio method integrated with theoretical alpha correction was applied for the determination of total iron.
The calculation of theoretical alphas with scattering ratio is a newly integrated function to Rigaku’s FP software.
Results
Total iron calibration curve is shown in Figure 1. The accuracy obtained in this application is excellent and comparable to traditional wet chemical analysis.
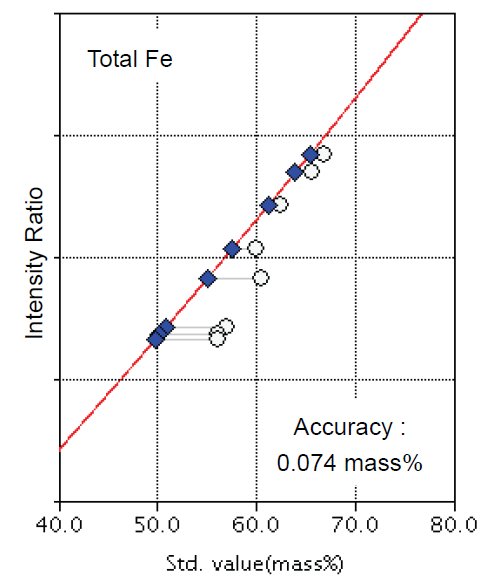
Figure 1: Calibration curve of total iron open circle: uncorrected point filled diamond: point with correction
The calibration curves of the other representative components, SiO₂, Al₂O₃, CaO and P, are shown in Figure 2.
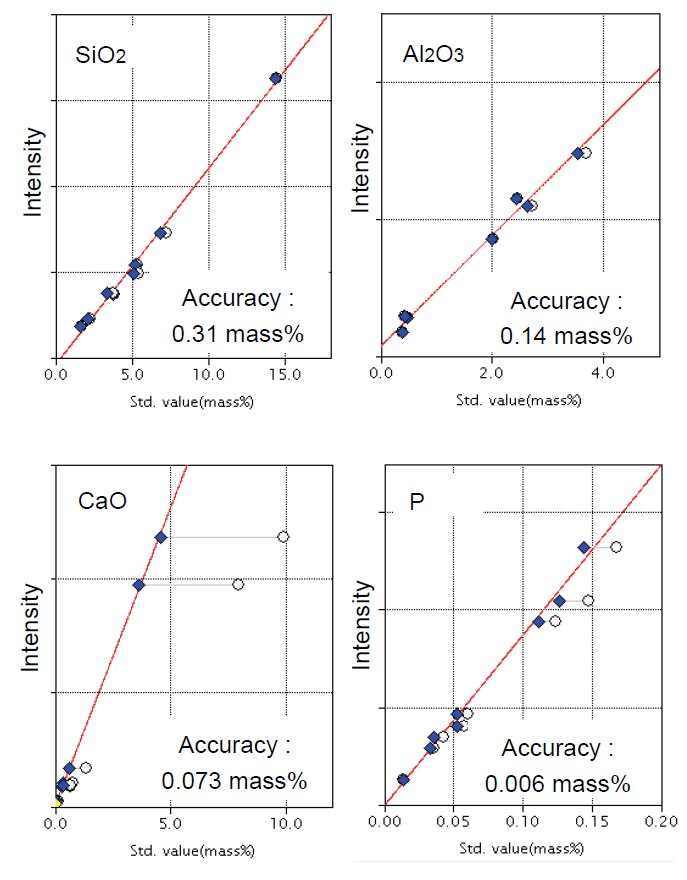
Figure 2: Calibration curves of representative components in iron ore. Symbols are same as Figure 1.
Phosphorus is a minor element of iron ore but is an important impurity that affects iron-making and quality. Therefore, phosphorus is one of the key components to be monitored even at very low levels. Lower limit of detection (LLD) of phosphorus is 0.0002 mass%. It is calculated according to the following formula:
$LLD = 3 \cdot \frac{1}{m} \cdot \sigma_B = 3 \cdot \frac{1}{m} \cdot \sqrt{\frac{I_B}{1000 \cdot t}}$
$m$ : sensitivity of calibration (kcps/mass%)
$σ_B$ : standard deviation of blank intensity (kcps)
$I_B$ : intensity of the blank (kcps)
$t$ : counting time (s); 100 s is used
Table 1: Accuracy of the calibrations (unit: mass%)
| Component | Concentration range | Accuracy |
| Total Fe | 56.06 - 66.83 | 0.074 |
| SiO₂ | 1.70 - 14.47 | 0.31 |
| CaO | 0.031 - 9.91 | 0.073 |
| Mn | 0.025 - 0.503 | 0.0033 |
| Al₂O₃ | 0.38 - 3.69 | 0.14 |
| TiO₂ | 0.060 - 7.77 | 0.016 |
| MgO | 0.038 - 3.28 | 0.12 |
| P | 0.014 - 0.168 | 0.0062 |
| S | 0.002 - 0.845 | 0.0033 |
| K₂O | 0.007 - 0.178 | 0.0016 |
| V | 0.003 - 0.46 | 0.0035 |
Table 2: 10 time repeat measurement (Iron sand) (unit: mass%)
| Component | Certified Value | XRF | ||
| Average | Std.dev. | RSD% | ||
| Total Fe | 57.03 | 57.12 | 0.055 | 0.097 |
| SiO₂ | 3.73 | 4.01 | 0.017 | 0.43 |
| CaO | 1.33 | 1.32 | 0.005 | 0.37 |
| Mn | 0.503 | 0.507 | 0.003 | 0.57 |
| Al₂O₃ | 3.69 | 3.63 | 0.009 | 0.24 |
| TiO₂ | 7.77 | 7.79 | 0.014 | 0.18 |
| MgO | 3.28 | 3.31 | 0.026 | 0.79 |
| P | 0.168 | 0.176 | 0.002 | 0.95 |
| S | 0.006 | 0.006 | 0.000 | 6.8 |
| K₂O | 0.078 | 0.080 | 0.002 | 3.0 |
| V | 0.3 | 0.29 | 0.002 | 0.66 |
Accuracies of the calibrations for all components measured in this note are listed in Table 1.
One of the CRMs was measured to test the precision by using this method. Table 2 is results of 10 time repeat measurement.
Conclusions
This application note demonstrates that the pressed powder method with Rigaku’s correction technology gives excellent results in determination of total iron concentration of iron ores.
Highly accurate total iron calibration curve obtained from a variety of reference samples composed of the natural and processed iron ores proves that this method is applicable to iron ores which have different mineralogies.
The calibration, however, becomes slightly less accurate in the case of the addition of iron ores consisting of predominantly of goethite (the iron hydroxide mineral).
The pressed powder method is fast, simple and a low-cost sample preparation method relative to the fusion method and wet chemical technique so that it has advantages in both cost-efficiency and high-throughput in analysis. Therefore, this total iron determination method is widely used on mine sites, pellet plants and even though sinter plants and steel manufacturing stock yards, etc.
Supermini200 is a benchtop spectrometer which is a space-saving instrument available with wall outlet only. Since Supermini200 is not site-specific, it has a great advantage that it can be installed at a mine site or plant laboratory.
