Phase ID Analysis of Micro-impurities on the Surface of a Tablet by Micro-area XRD Measurements
Introduction
Medicines generally consist of an active ingredient (active pharmaceutical ingredient) and diluents for pharmaceutical formulation. The most common form of a drug product is a tablet. If a coloring agent has adhered to the surface of a tablet during the tableting process using a tableting machine, the substance can be analyzed to identify the changes in the tablet’s composition and the source of the contamination. In this measurement, we determined the crystal phase of a red-colored material adhering to the surface of a mock tablet and the presumed the source of the contamination.
Measurements and results
Since the areas where the red material adhering to the tablet surface are around 100 to 300 μm in diameter, an XRD measurement was performed using CBO-μ optics, which can focus the X-ray beam to approximately 100 μm. During the measurement, an image of the entire tablet (8.0 mm × 17.5 mm) was taken using a sample observation camera inside the instrument (Figure 1, left). XRD patterns were obtained at 100 measurement points in the range of 2.0 mm x 5.0 mm with a 0.2 mm pitch (Figure 1, center). When the XRD patterns were stacked, peaks that may be attributed to the foreign matter were viewed at several measurement points at 2θ = 33.2 ̊ and 35.6 ̊. As the result of a qualitative analysis, these peaks were identified as those of Fe₂O₃ (red rust) (Figure 2). The right figure of Fig. 1 shows the measurement points at which red rust was observed. According to this, we can presume that the foreign matter originated from iron components of the tableting machine. (1)
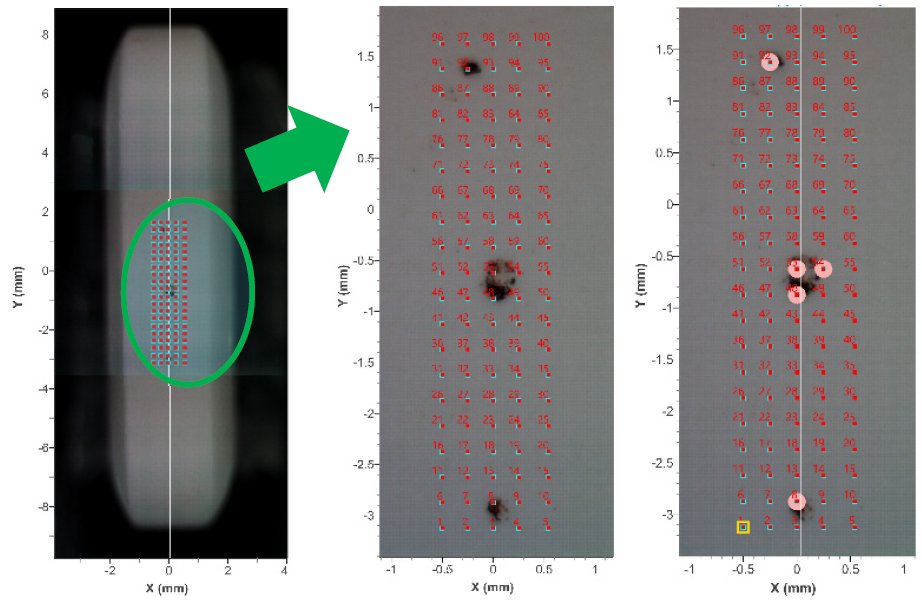
Figure 1: Image from the sample observation camera (left) The whole image of the tablet (center) XRD measurement positions (right) Observation positions of red rust
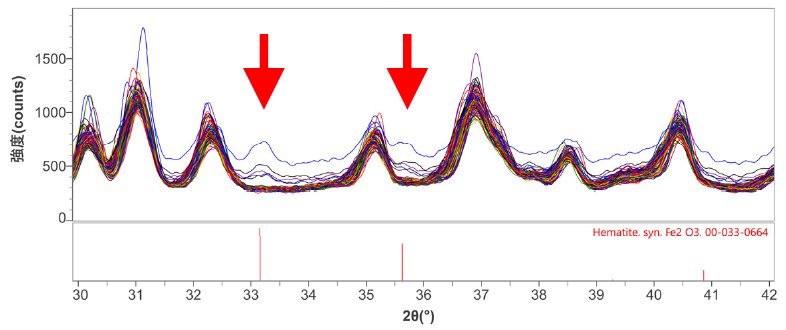
Figure 2: Multiple XRD patterns of measurement points and qualitative analysis result
References
(1) Video: "High-precision micro-area analysis, XY mapping. Perfect measurement in micro-areas", https://youtu.be/evdBEWTs7ZA.

Contact Us
Whether you're interested in getting a quote, want a demo, need technical support, or simply have a question, we're here to help.