Evaluation of the Crystallinity of a Carious Tooth using X-ray Diffraction
Introduction
Crystalline substances are present in our bodies; for example, in bones and teeth. Their crystallinity is considered to be related to their functionality and to be affected by overall health and nutritional conditions. We performed X-ray diffraction mapping measurements of a human tooth with a carious lesion (wisdom tooth) as a biological sample of a crystalline substance to evaluate the differences in crystallinity between the different parts of the tooth.
Measurements and results
The sample was polished to make the measurement surface sufficiently flat (Figure 1). In this experiment, multiple measurements were performed periodically in one direction using a 2D detector and a convergent optical element that focuses X-rays to φ0.1 mm (at right-angled incidence) (Figure 2). Figure 3 shows the 2D diffraction patterns and the corresponding 1D conversion profiles of enamel, carious lesion, and dentin. When comparing the profiles of enamel (Figure 3 (1)) and dentin (Figure 3 (3)), we can see that, although both identified compounds are hydroxyapatite, the peak widths of their diffraction lines are different: the enamel peak is narrower than the dentin peak. This indicates that the crystallinity (the degree to which the crystallites are arranged in order) of enamel is higher than that of dentin. The identified compound of the carious area (Figure 3 (2)) is also hydroxyapatite, but a halo was observed in the low-angle region. This indicates that hydroxyapatite was melted by acid in the carious lesion and became amorphous. Therefore, the X-ray diffraction technique allows you to identify not only chemical compounds but also the presence/absence of crystalline and/or amorphous substances.
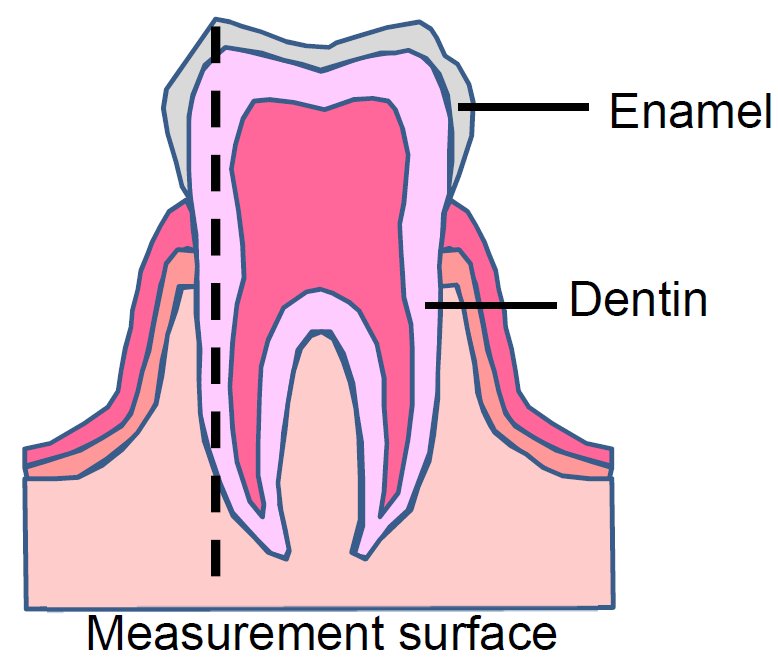
Figure 1: Structure of a human tooth
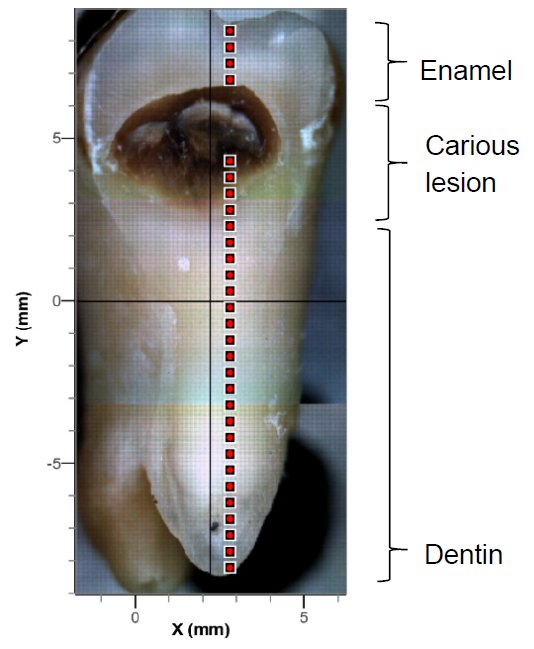
Figure 2: Sample image and mapping location
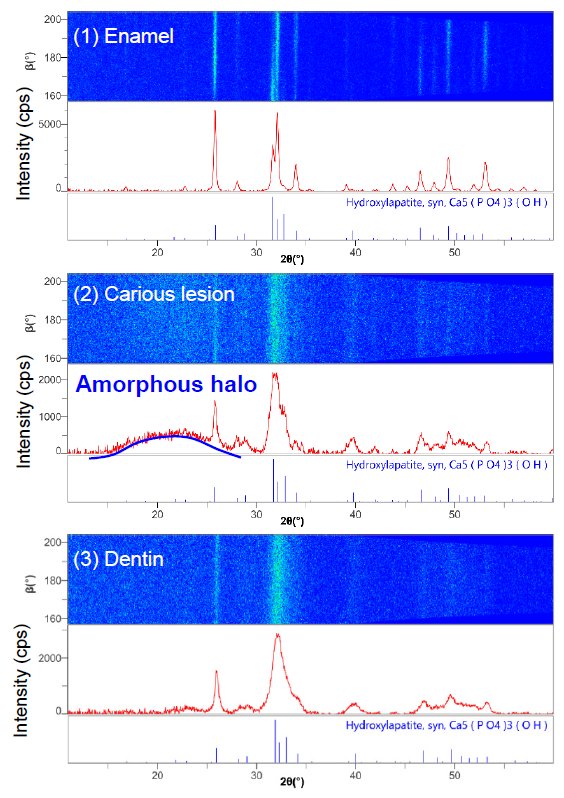
Figure 3: 2D diffraction patterns, 1D conversion profiles, and qualitative analysis results of enamel, carious lesion, and dentin

Contact Us
Whether you're interested in getting a quote, want a demo, need technical support, or simply have a question, we're here to help.