Phase ID and Orientation Analysis for Thin Film SOFC Material using 2DD
Introduction
Thin films formed on substrates show various crystal phase and orientations depending on the materials and manufacturing method. Therefore, phase identification is sometimes difficult by ordinary X-ray diffraction (XRD) measurement. The diffraction image using a two-dimensional (2D) detector reveals the lattice constant and the orientation for each crystal phase readily because the diffraction intensity distribution in the 2θ direction and the distribution of the crystal orientation in the χ direction are observed simultaneously.
Measurements and results
Figure 1 shows the out-of-plane XRD (θ/2θ scan) profile for a (La, Sr) (Co, Fe) O₃ (LSCF) film on an yttria-stabilized zirconia (YSZ) single crystal substrate. In the profile, all but two of the diffraction peaks (↓) can be attributed to YSZ and LSCF. From phase identification using the ICDD database, these were initially assumed to be diffraction peaks belonging to (La, Zr)O.
Figure 2 shows the diffraction image of this sample using a two-dimensional detector. YSZ produced spot-like diffraction patterns characteristic of single crystals. In contrast, LSCF produced continuous Debye rings typical of a randomly oriented material. The diffraction peaks presumed to be (La, Zr)O (↓ in Figure 2) were spot-like similarly to YSZ. In comparison to the YSZ peaks, they displayed more significant elongation of the spot in the χ direction (Figure 3). Thus, the degree of orientation of (La, Zr)O was confirmed lower than that of the YSZ substrate. In summary, using a 2D detector enables to confirm the orientation of each crystal phase quickly and conveniently.
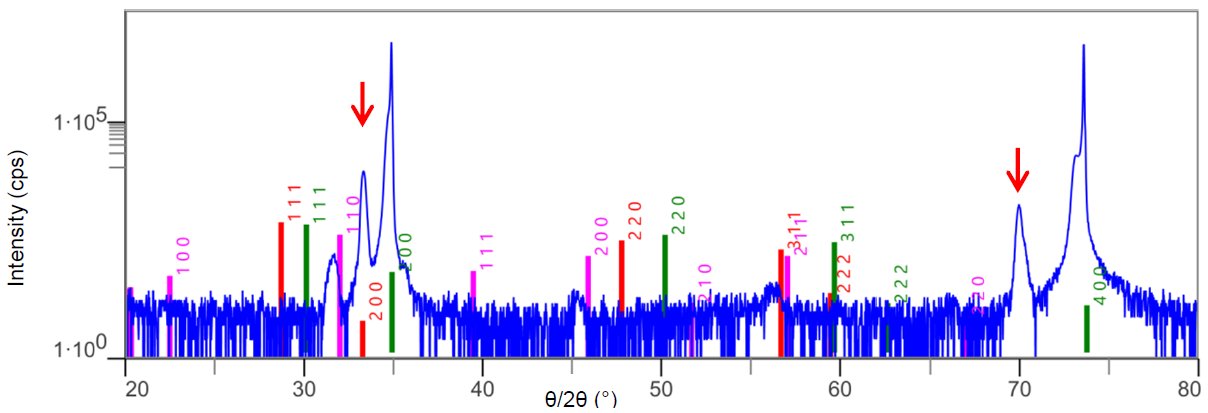
Figure 1: The out-of-plane X-ray diffraction profile for LSCF thin film using CuKα₁. (―) YSZ, (―) LSCF, (―) (La, Zr)O
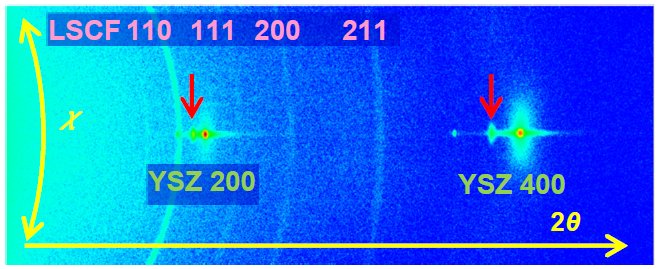
Figure 2: The 2D diffraction image for LSCF thin film using CuKα₁. ↓ were assumed to be diffraction peaks due to (La, Zr)O.
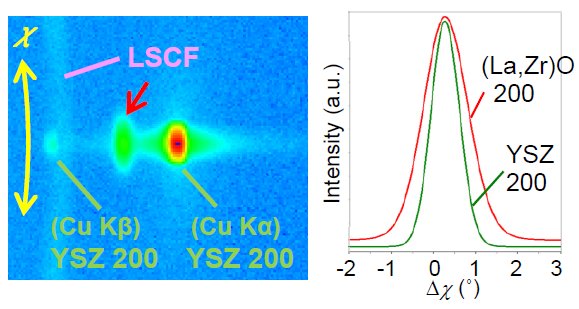
Figure 3: The enlarged view of YSZ 200 reflection (left), and the comparison between χ profile (right).
Samples provided by: The National Institute of Advanced Industrial Science and Technology (AIST).

Contact Us
Whether you're interested in getting a quote, want a demo, need technical support, or simply have a question, we're here to help.