Verifying the Validity of Crystallite Sizes Determined by the FP Method
Introduction
A crystallite is the smallest unit contributing to X-ray diffraction and is defined as a domain that is treated as a single crystal in crystalline grains. It is known that the chemical and physical properties of industrial products correlate with the crystallite size, so it is very important to accurately measure the crystallite size. The Scherrer method, the Williamson-Hall method, and the FP (fundamental parameter) method are used to determine crystallite size from X-ray diffraction profiles. In particular, the FP method allows the precise calculation of crystallite size and distribution because it can correct the width of the diffraction peak using information about the optical system used on the diffractometer. In this example, we verified the validity of the values by comparing the crystallite size calculated with the FP method to the results measured using other methods.
Measurements and results
A TiO2 powder sample of rutile was measured using para-focusing optics with a 1D detector. The FP method was used for crystallite size analysis. Particle size evaluation was performed using other methods: SEM (scanning electron microscope), LD (laser diffraction), and USAXS (ultra-small angle X-ray scattering) for comparison. SEM was performed using a JSM-64060LV (JEOL), LD was performed using an LS 13 320 (BECKMAN COULTER), and a NANOPIX mini (Rigaku) was used for the USAXS measurement.
From the image obtained by SEM, it was estimated that the TiO₂ particles are close to the crystallite (single crystal) (Figure 1). The average particle sizes obtained by LD and USAXS were 189 nm and 190 nm, respectively, and the median particle sizes were 164 nm and 160 nm, respectively (Table 1). The average crystallite size calculated by XRD (FP method) was 186 nm and the median crystallite size was 168 nm, both similar to those determined by the other methods (Table 1).
In addition, the cumulative frequency distributions obtained by each method are shown in Figure 2.
These results prove the accuracy of the crystallite size calculated by the FP method is high, since the results obtained for the primary particles of TiO₂ highly correlate to those of other measurement methods.
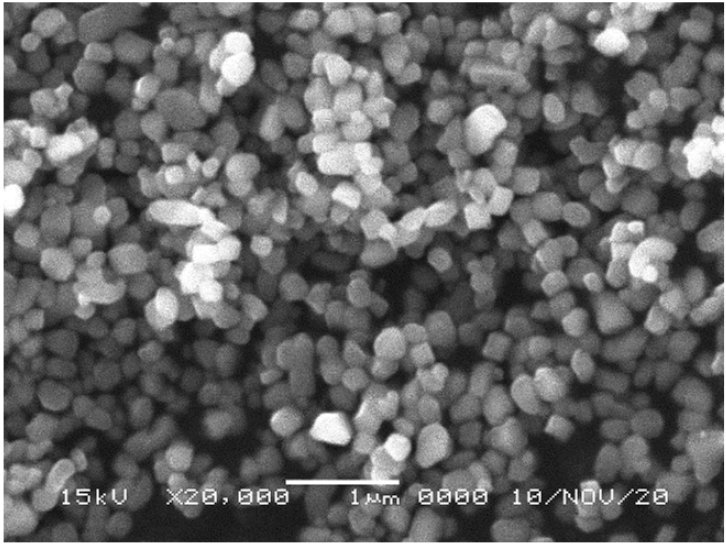
Figure 1: SEM image of TiO₂ particles
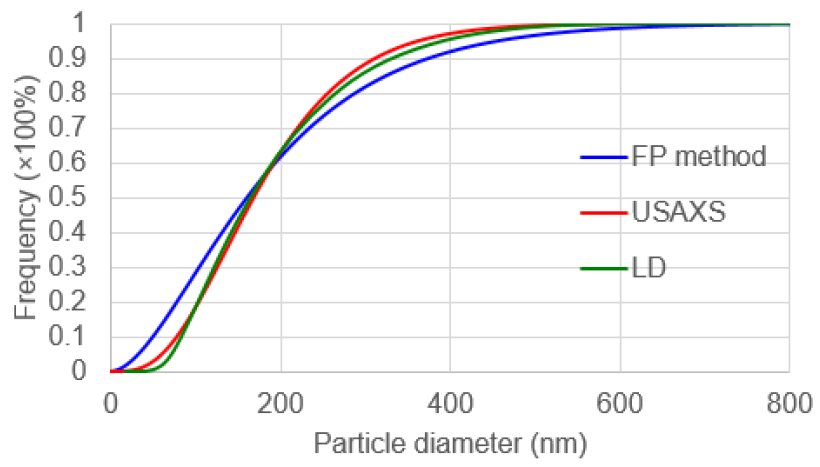
Figure 2: Cumulative frequency distribution of the TiO₂ particles obtained by each method
Table 1: Particle and crystallite size of TiO₂ particles obtained by each method
| Method | Average size D (nm) | Median size D50 (nm) |
| LD | 189 | 164 |
| USAXS | 190 | 160 |
| XRD (FP method) | 186 | 168 |

Contact Us
Whether you're interested in getting a quote, want a demo, need technical support, or simply have a question, we're here to help.