Quantitative Analysis of Crystal Polymorphs by the DD Method
Introduction
In the Direct Derivation (DD) method, quantitative analysis is performed using the sum of the X-ray intensities scattered from each crystalline phase and the chemical composition information (1), (2). In some fields, such as pharmaceuticals, many compounds are not listed in databases. In these cases, it is difficult to calculate quantitative values using conventional methods, and thus quantitative analysis using the DD method is considered effective. In this example, each crystalline phase of a compound having different polymorphic forms was measured, and then quantitative analysis of a mixture using the results from the pure forms was performed.
Measurements and results
The pure substances of crystal polymorphs I, II, and III and their mixture were placed into zero-background sample holders. The X-ray diffraction measurements were performed using the para-focusing method.
The measurement conditions are as follows: wavelength: Cu Kα, X-ray tube output: 45 kV-200 mA, 2θ: 3 to 40°, speed: 10°/min
A d-I list was created from the X-ray diffraction profiles of crystal polymorphs I, II, and III. Then the X-ray diffraction profile of the mixture was fitted using the Rietveld method. Figure 1 shows the results of this fitting. Residual intensities were observed at 2θ = 13.9°, 18.7°, and 21.6° due to peaks of polymorph I. This suggests that polymorph I has preferred orientation in the sample holder. In addition, the Rwp and S values, which are the indicators of good fitting, were calculated as 11.4% and 6.16, respectively.
In order to take preferred orientation into account, the analysis was performed using the DD method, which combines Pawley fit and the method using measurement profile shapes. Figure 2 shows the result of fitting the X-ray diffraction profile of the mixture with the DD method. Compared to Figure 1, the residual intensities are reduced and the Rwp and S values are calculated as 3.60% and 2.09, respectively.
The above results prove that the DD method is better-suited than the Rietveld method for the quantitative analysis of crystalline phases that are not listed in databases and are easily oriented.
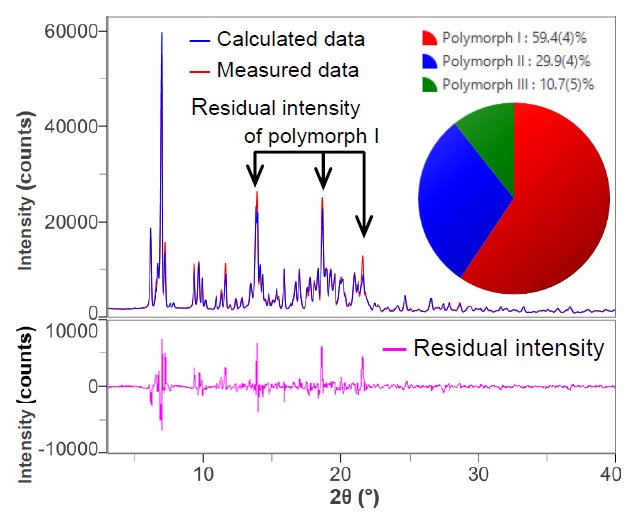
Figure 1. The results of fitting and quantitative analysis of mixture using the Rietveld method
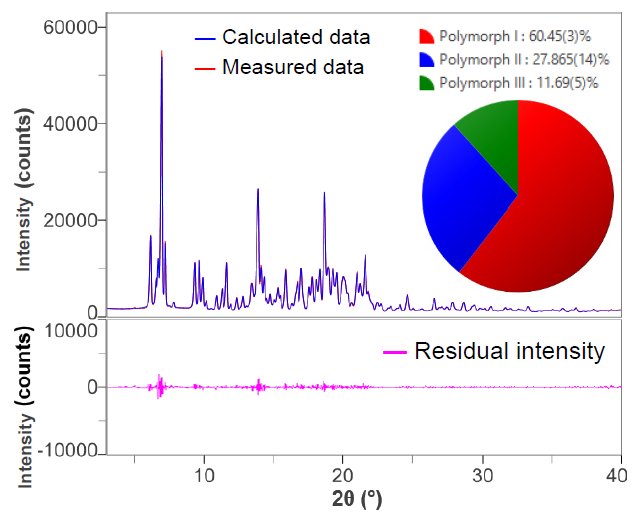
Figure 2. The results of fitting and quantitative analysis of mixture using the DD method
References
(1) H. Toraya: Rigaku Journal (English version), 34(1) (2018) 3-8.
(2) H. Toraya: Rigaku Journal (English version), 35(2) (2019) 27-34.

Contact Us
Whether you're interested in getting a quote, want a demo, need technical support, or simply have a question, we're here to help.