Structural Characterization of Zeolite by Electron Density Analysis
Introduction
Zeolites, which are microporous aluminosilicates, have excellent properties, such as water absorption ability, ion exchange capacity, molecular sieving ability, and catalytic ability. In terms of catalytic ability, they have been commercialized as NH₃-SCR (Selective Catalytic Reduction) catalysts for NOₓ abatement in diesel engines. CHA-type zeolite, which can enhance the catalytic activity for NOₓ by Cu-ion-exchange, is generally used for the SCR catalyst. Since the atomic position of Cu influences the catalytic activity and stability, the difference Fourier synthesis and the MEM (Maximum Entropy Method), which allow visualizing differences in electron density distributions calculated from a model and observations, are essential to develop and characterize the material.
Measurements and results
In general, exhaust gas resulting from combustion contains high-temperature steam. In this measurement, the hydrothermal stability of Cu-exchanged CHA zeolite was characterized by XRD using the Reactor-X, which can reproduce an environment similar to exhaust gas containing 10 vol% steam introduced at a high temperature of 850°C. Figure 1 shows XRD profiles obtained immediately after steam introduction and those obtained after a few hours (3.3 and 6.6 hours). As the elapsed time after the introduction of steam increases, the intensities of the crystalline phase peaks decrease and the halo intensities from the amorphous phase increase, indicating the progress of amorphization. Figure 2 shows the results of the difference Fourier synthesis performed to determine the position of Cu in the zeolite during steam introduction. After 0 and 3.3 hours, Cu was located at the center of the six-membered ring of Si. After 6.6 hours, Cu was located at the center of two stacked 6-membered rings (1) (D6R: Double 6-membered Ring).
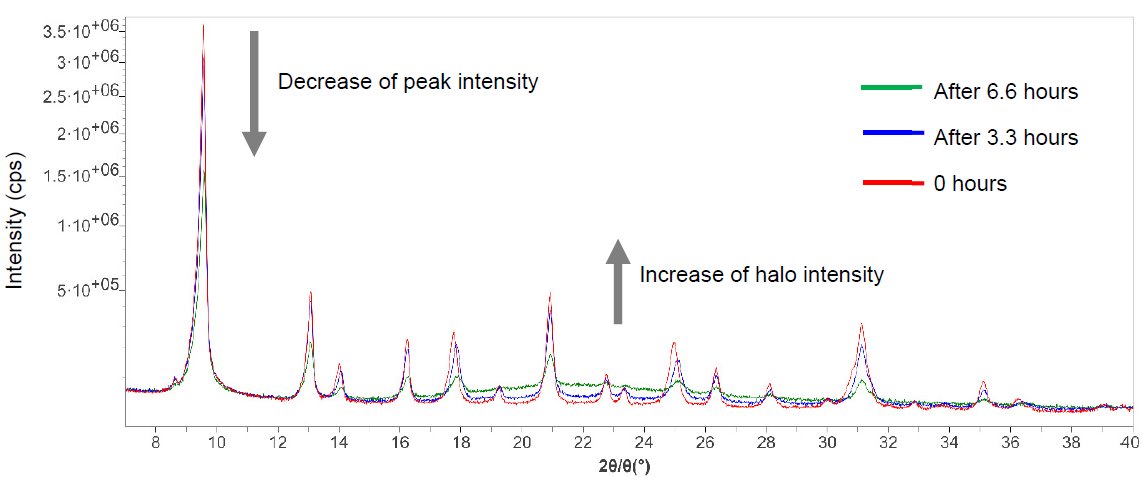
Figure 1: XRD profiles at 0, 3.3, and 6.6 hours after steam introduction
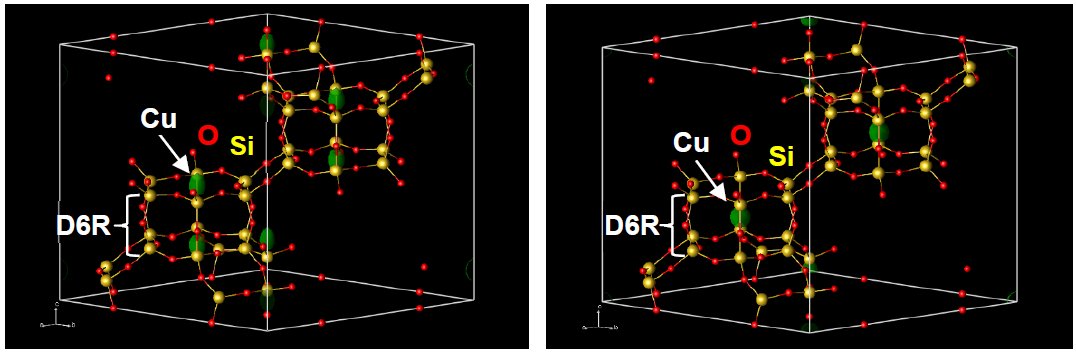
Figure 2: Difference Fourier synthesis results at 0 hours (left, almost the same after 3.3 hours) and 6.6 hours (right) after steam introduction (green sphere is the difference in electron density).
Reference
(1) T. Usui, et al.: ACS Omega, 4 (2019) 3653-3659.

Contact Us
Whether you're interested in getting a quote, want a demo, need technical support, or simply have a question, we're here to help.