Observation of Phase Transition Behavior of Pharmaceutical Materials with a Benchtop XRD System
Introduction
DSC measurements can be performed to identify dehydration or crystal phase transitions of pharmaceutical raw materials, but these measurements can only provide a prediction to identify the compounds created after reactions based on the melting point. On the other hand, X-ray diffraction measurements with sample heating (in-situ XRD) allow identification of the change in crystal structures due to heating. In the following example, the phase transition behavior of lactose monohydrate was examined using a combination of a benchtop XRD system and a temperature control attachment.
Measurements and results
Figure 1 shows DSC measurement results of lactose monohydrate: endothermic peaks appeared at 145.5°C and 170.0°C, and an exothermic peak appeared at 175.0°C, all of which were below the melting point. These exothermic and endothermic reactions can be attributed to phase transitions with dehydration, but the compounds created by the reactions cannot be identified.
Figure 2 shows in-situ XRD profiles of lactose monohydrate measured by a benchtop XRD system. This waterfall plot indicates that different profiles were obtained at 100°C, 150°C, and 180°C. Phase identification was performed on these profiles, which identified that the lactose monohydrate changed to hygroscopic α-lactose (monoclinic system) and stable α-lactose (triclinic system) (Figure 3).
Note: This in-situ XRD measurement was performed with a sample heating rate of 5°C/min and a scan speed of 20°/min.
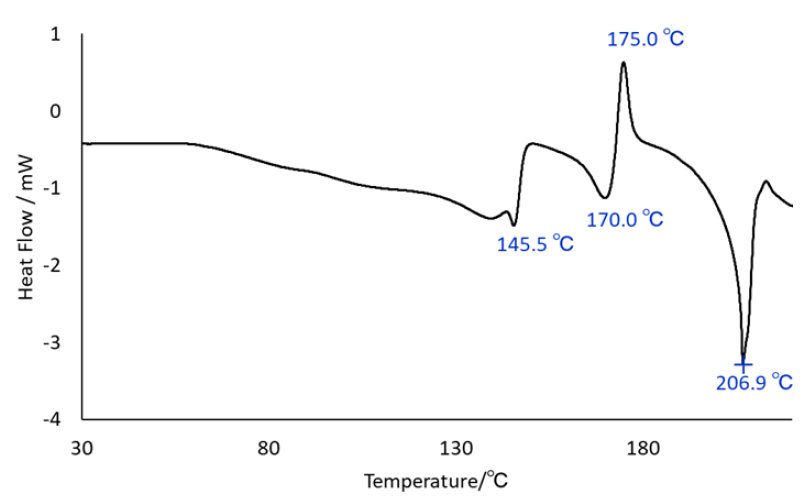
Figure 1: DSC chart of lactose monohydrate (measured by an independent DSC system)
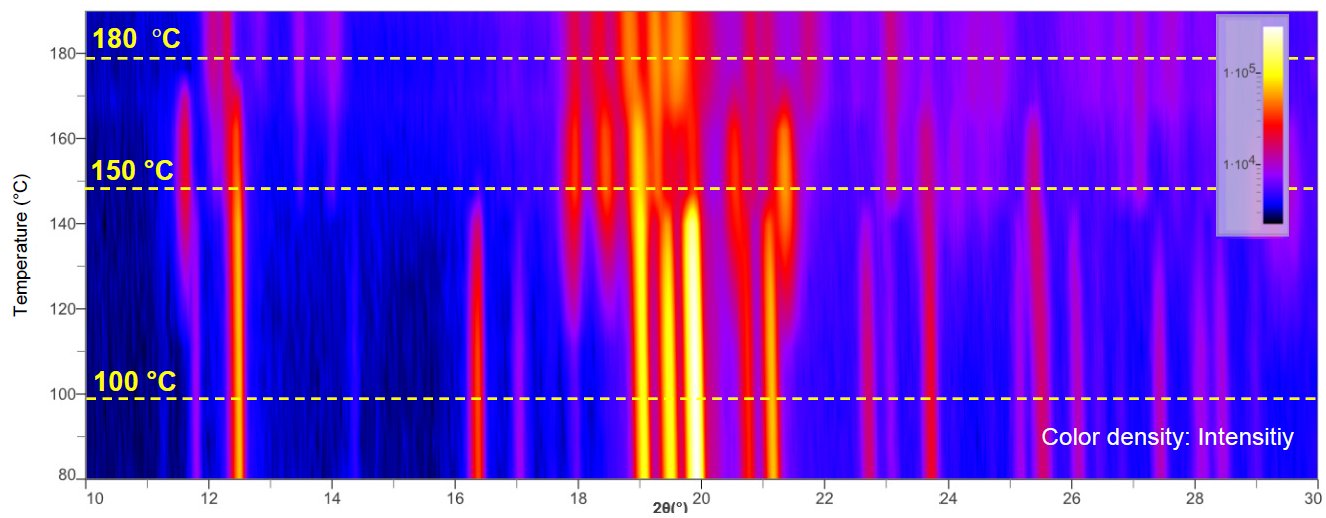
Figure 2: Results of in-situ XRD of lactose monohydrate with a benchtop XRD system (waterfall plot)
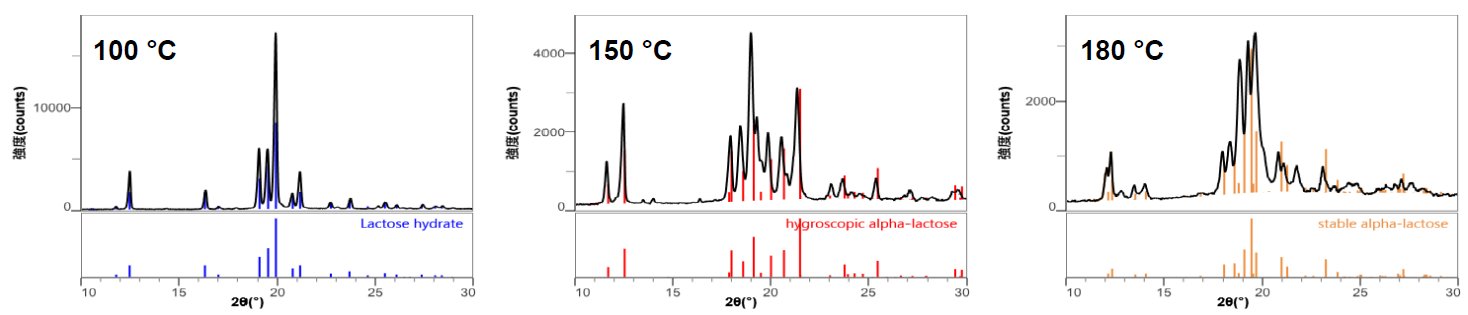
Figure 3: Crystal phase identification of the profiles obtained at 100°C, 150°C, and 180°C

Contact Us
Whether you're interested in getting a quote, want a demo, need technical support, or simply have a question, we're here to help.