Crystallization of Chocolate Observed by XRD-DSC
Introduction
Chocolate gets its mild taste, flavor, and meltable texture through tempering. The tempering process deliberately changes the crystallization temperature, thereby controlling the crystal phase efficiently. Cocoa butter has several polymorphs that show different sub-lattice structures. Among them, type V is known as the best for chocolate production because of its stability and high melting point. Its formation is controlled by the tempering speed. Here we study the crystal structure and crystallization temperature of chocolate obtained under several tempering speeds by simultaneous XRD-DSC measurement.
Measurements and results
After melting type V chocolates at 38°C, the crystallization processes were studied under different cooling rates. Table 1 shows the onset and peak temperatures of the exothermic peaks, the early-stage temperature where the observation of the X-ray diffraction peak begins, and the crystal phases. The onset temperature at which crystallization begins shifts to the high-temperature side by controlling the cooling rate from 5 to 0.5°C/min. The temperature interval between the onset and the peak temperature at which crystal growth is almost complete decreases as the cooling rate is slowed. The X-ray diffraction profiles show the phase transition from type II to type V. These results indicate that the nucleation of stable phase, type V, is sufficiently formed at high temperatures by a slow cooling rate, and crystal growth is rapidly achieved. Simultaneous XRD-DSC measurements facilitate the study of the onset-temperature of crystallization, something that is difficult to observe in X-ray diffraction data alone. In addition, changes to the X-ray diffraction profile give information on whether the endothermic peak observed from DSC measurement is caused by melting or a structural phase transition.
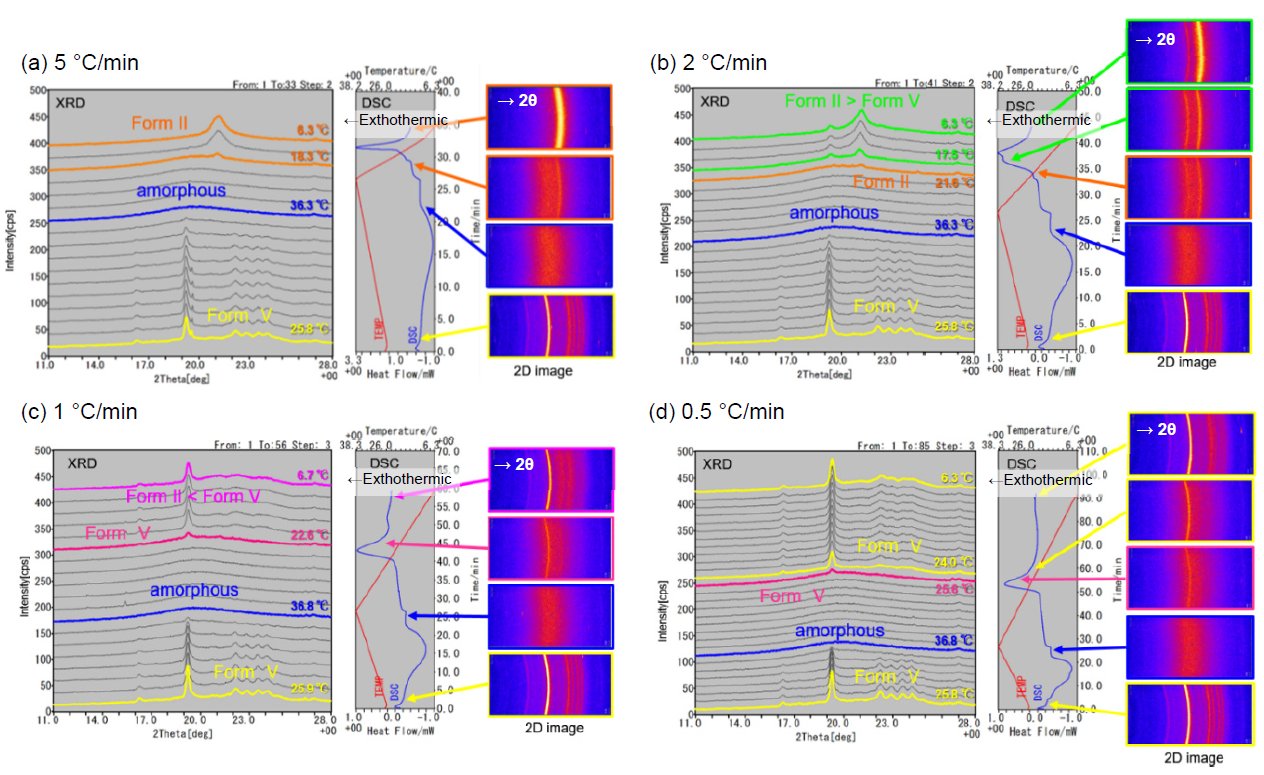
Figure 1: Results of simultaneous XRD-DSC measurement by different cooling rates
Table 1. The onset and peak temperatures of exothermic peaks of DSC curves, and early-stage temperature where the observation of X-ray diffraction peak begins, and the crystal phases
| Cooling rate (°C/min) | Exothermic peak of DSC | X-ray diffraction | |||
| Onset temperature | Temperature of peak (°C) | Temperature of early stage (°C) | Crystal phase | ||
| First peak | Second peak | ||||
| 5 | 21.6 | 15.2 | – | 17 | II |
| 2 | 22.3 | 17.4 | 15.1 | 20 | II >> V |
| 1 | 23.2 | 20.9 | – | 23 | II > V |
| 0.5 | 25.3 | 23.9 | – | 24 | V |

Contact Us
Whether you're interested in getting a quote, want a demo, need technical support, or simply have a question, we're here to help.