Quick Pole Figure Measurement of a Metal Material using 2DD
Introduction
Generally, characterization of texture in metal materials using X-ray diffraction is carried out using pole figures of multiple indices. The Shultz reflection method using the 0-Dimensional (0D) mode is widely used to obtain pole figures. However, the 0D mode requires measurement of pole figures of reflections one-by-one and the collection of background intensity for each alpha position. These results in long measurement times. Intensities at different alpha positions can be collected simultaneously from the intensity distribution on a Debye ring by using a 2-dimensional (2D) detector. “2D pole figure measurement” allows you to obtain pole figures in much shorter timeframes compared to 0D pole figure measurement, thus accelerating your research.
Measurements and results
Measurement of the 2D diffraction image requires a point beam producing a circular irradiation area on a sample surface using a collimator or point convergence optic on the incident side. Additionally, it is recommended that the sample-detector distance is as short as possible to collect a wide alpha range of a Debye ring (Figure 1). The 2D pole figure measurement is performed with multiple tilt angles (chi), and then these pole figures are combined by normalization. The “Pole figure measurement (2D) part” feature of the SmartLab Studio II software allows you to calculate the chi and omega position so that the intensity at the center of pole figure can be obtained and the alpha range in each chi position can be joined (Figure 2). A conversion area to create a pole figure on the 2D diffraction image is set as shown in Figure 3. It is possible to create pole figures of multiple indices simultaneously when multiple diffractions are observed on the detector plane. The background intensity measurement is not required in the 2D pole figure measurement because it is already obtained simultaneously on the 2D image along with the diffraction image intensity. The pole figure measurement for the Titanium plate sample was performed with chi: 22˚ and 66˚. The pole figures from the two chi angles are merged. Figure 4 shows Ti 100, 002 and 101 pole figures after orthorhombic symmetric operation and normalization. The 2D pole figure measurement is advantageous particularly when one wants to illuminates a micro area where it is difficult to obtain sufficient intensity using the 0D pole figure measurement technique.
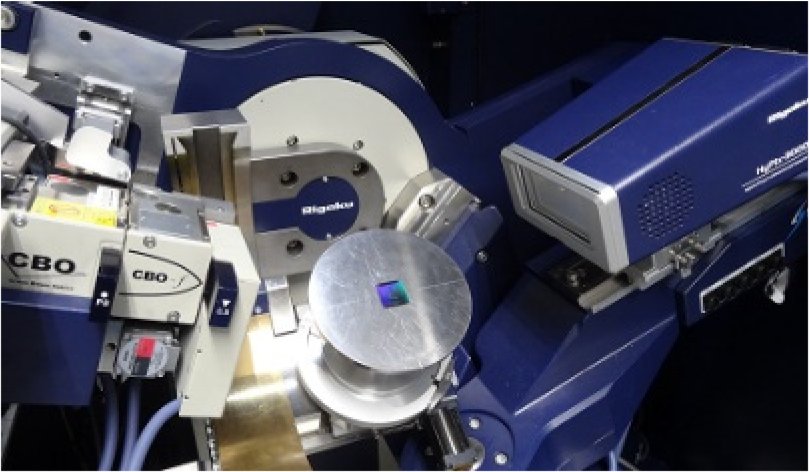
Figure 1: Instrument configuration for 2D pole figure measurement
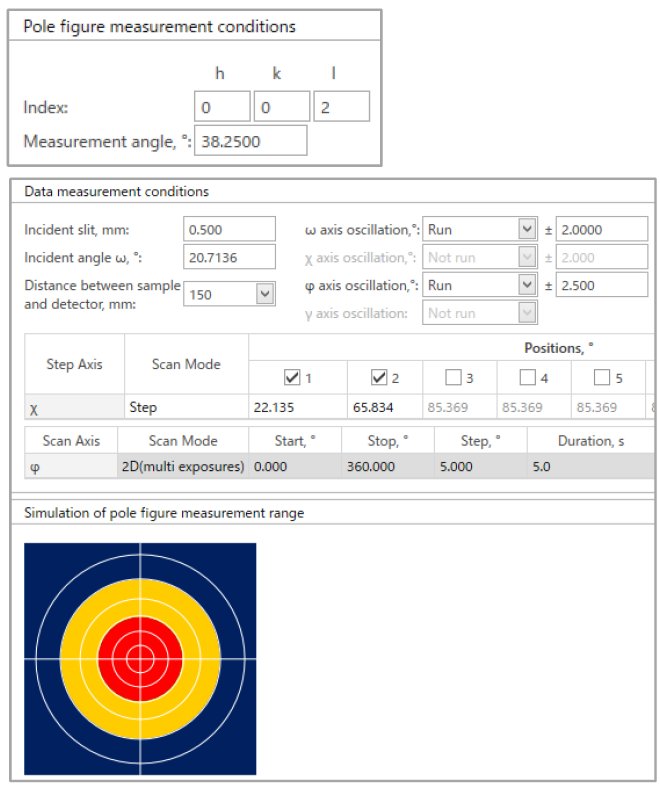
Figure 2: “Pole figure (2D)” part in SmartLab Studio II parameter settings
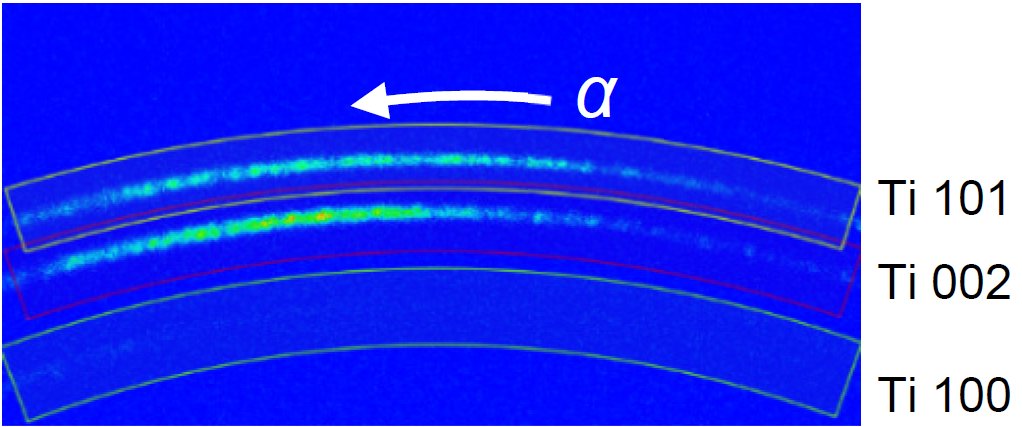
Figure 3: 2D diffraction image of Ti plate (chi: 22˚)
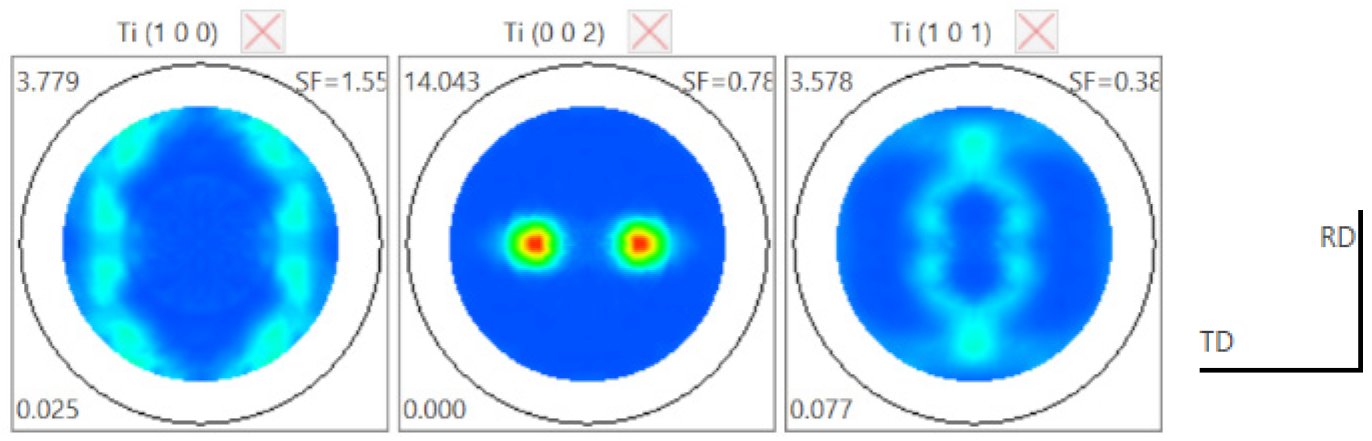
Figure 4: 100, 002 and 101 pole figures of Ti plate

Contact Us
Whether you're interested in getting a quote, want a demo, need technical support, or simply have a question, we're here to help.