Quantitative Analysis of 3-component Sample by DD method
Introduction
Quantitative analysis by powder X-ray diffraction has long been carried out using calibration curves, a technique that requires preparing samples whose components are quantified, using pure or standard substances to obtain calibration curves. In recent years, quantitative analysis without calibration curves has become possible by calculating quantitative values from crystal structures. However, these methods require the crystal structures of the materials, limiting the applicable substances. With the Direct Derivation method introduced here, the quantitative weight fractions of individual crystalline phases can be derived from sets of integrated intensities collected in a wide 2θ range, together with chemical composition data.
Measurements and results
A mixed powder sample of corundum (Al₂O₃, 33.3 mass%), calcite (CaCO₃, 40.0 mass%), and anatase (TiO₂, 26.7 mass%) was analyzed by the DD method.
- A powder X-ray diffraction profile was measured (Figure 1).
- The chemical composition of each phase was determined by phase identification (Figure 2).
- The total integrated intensities of each of the crystalline phases were calculated by the fitting method. Then the weight fractions of the phases were obtained by the DD method (Figure 3).
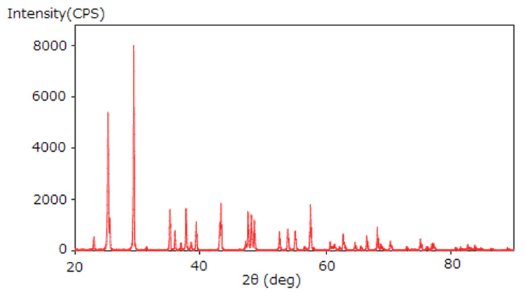 Figure 1: Powder XRD profile of the mixture
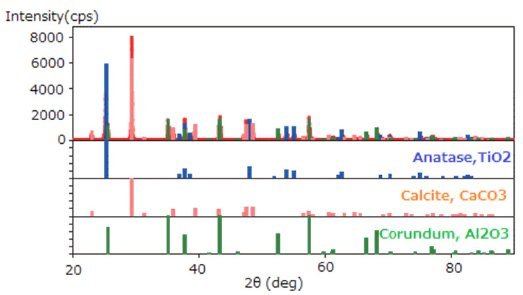 Figure 2: Results of phase identification
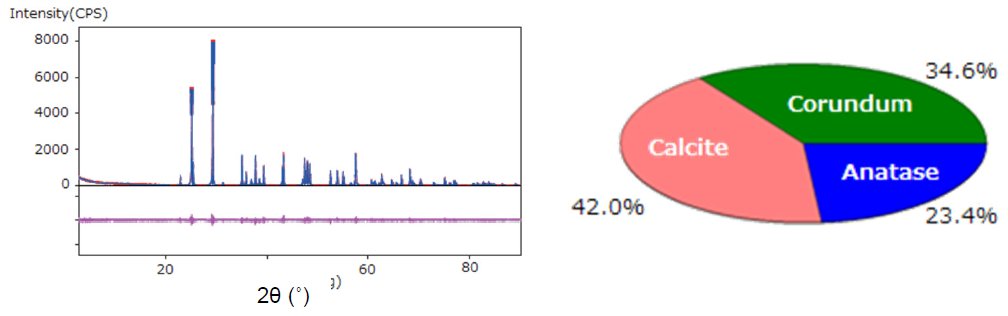
Figure 3: WPPF by the Pawley method and results of quantitative analysis by the DD method.
References
H. Toraya: J. Appl. Cryst., 49(2016), 1508-1516
H. Toraya: Rigaku Journal (English version), 34 (1) (2018), 3-8

Contact Us
Whether you're interested in getting a quote, want a demo, need technical support, or simply have a question, we're here to help.