Direct Observation of Melting and Crystallization of Fresh Cream
Introduction
To investigate the crystal structure of a material sensitive to changes in environment, it is necessary to obtain diffraction data rapidly and accurately under a precisely controlled measurement environment. By combining a two-dimensional (2D) detector with attachments that precisely control ambient conditions such as temperature, humidity, and inert gas, even fast structural changes are revealed in the 2D diffraction patterns. Massive 2D data obtained during the in-situ measurement can easily be converted to 2θ-intensity (I) data by the Data Visualization (DV) plugin of SmartLab Studio II. In addition, the DV plugin includes useful functions that batch-process all structural parameters, such as peak position, d-value, crystallite size, etc., and plot all of them on one graph. Here, this outstanding feature of the DV plugin is demonstrated through the data pro- cessing of a large number of 2D images of vegetable based cream (VBC) obtained by DSC and HyPix-3000.
Measurements and results
We investigate the temperature dependence of the crystal structure of a commercial VBC using X-ray DSC. VBC was heated and cooled at 2˚C / min while X-ray diffraction patterns were measured with an exposure time of 60 seconds/frame by installing the 2D detector in the longitudinal direction so that it could capture as wide a 2θ angle as possible. Figure 1 is the 2D diffraction image measured at -5˚C and 40˚C for heating, and 15˚C for cooling. The 2D image at -5˚C indicates the presence of a lamellar structure (LAM) and a sub-lattice (SL) of milk fat crystal, and additives. Figure 2 depicts the DSC curve and a time-dependent change in diffraction intensity of the 2θ-I profile converted from the 2D data of 57 images. Two endothermic peaks were observed, corresponding to melting of the SL and the LAM in the heating step. We investigated in detail the melting and crystallization temperature using the high-throughput processing function of the DV plugin. The SL considered to be β type melted at about 21˚C while heating, and crystallized at around 15˚C while cooling, whereas the LAM supposed to be 2L appeared around 29°C and 26°C while heating and cooling, respectively (Fig. 3). The d-value of the LAM decreased slightly and the integrated intensity increased significantly in the cooling process. This suggests that the spoiled taste and texture of VBC in summer is related to changes in the LAM. VBC stored in a refrigerator at a store is heated up on the way home and then chilled again in a refrigerator at home. The DV plugin clearly and readily displays a variety of structural information using the visualization and high-throughput function, as well as reducing data processing time for a large number of 2D images.
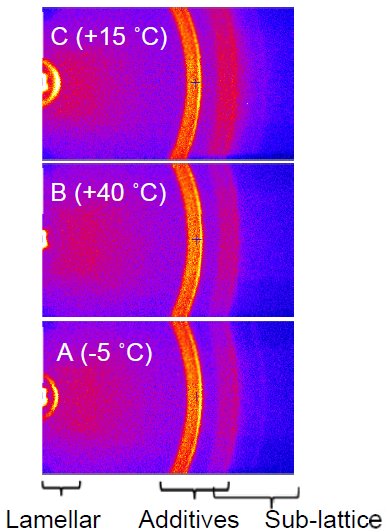
Figure 1: 2D data of fresh cream observed at -5°C and 40°C with heating and 15°C with cooling.
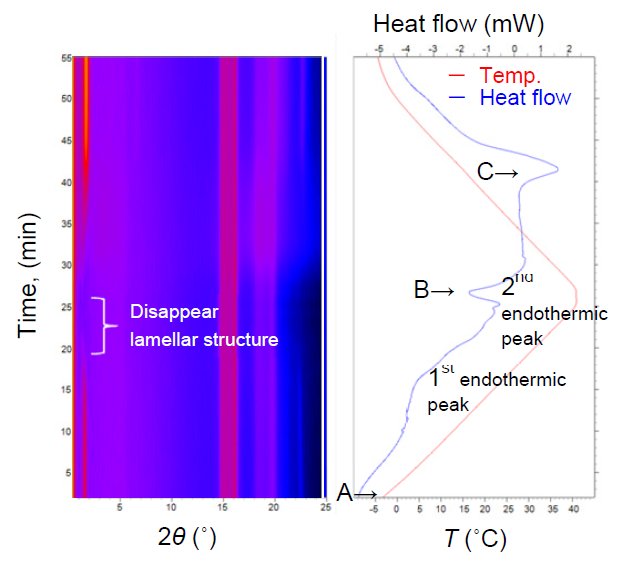
Figure 2: Time dependence of diffraction intensity (a) and DSC curve (b).
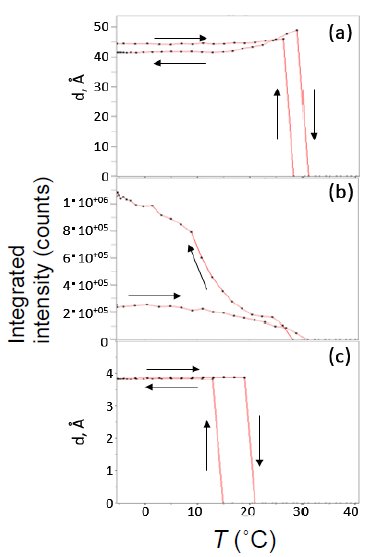
Figure 3. Temperature dependence of d-value (a) and integrated intensity (b) of lamellar structure, and d-value of sub-lattice (c).

Contact Us
Whether you're interested in getting a quote, want a demo, need technical support, or simply have a question, we're here to help.