Quantitative Analysis of Amorphous Components in Cement
Introduction
The peak separation method is often employed in quantitative analysis to analyze amorphous materials by X-ray diffraction techniques. Given the fact that crystalline components and amorphous components both have the same chemical compositions, it is very difficult to apply the peak separation method on samples consisting of multiple components, such as cement. In recent years, the Rietveld method has been used in quantitative analysis of such samples. In this method, the amount of amorphous material can be calculated by adding an internal standard substance to the sample. However, the disadvantages of this method are the complex procedure of adding and mixing the internal standard substance and the long time required for the analysis to be completed. Another quantitative analysis method, the RIR (Reference Intensity Ratio) method, uses the RIR value (intensity ratio of the subject component and corundum (α-Al₂O₃) when mixed in equal amounts). In contrast to the Rietveld method, if the RIR value of the subject component is known, an internal standard is unnecessary and the quantitative value can be determined by calculation. Here we performed a quantitative analysis of amorphous components in a powder sample consisting of multiple components by Rietveld analysis using the RIR method.
Measurement and result
Rietveld analysis using the RIR method was performed on a sample with 40mass% of amorphous SiO₂ added to a cement standard sample (NIST2686 standard reference material) (Fig.1). With respect to the certified value of the amorphous component (40 mass%), the analyzed value was 40.8(7) mass%. The certified and analyzed values matched well. The number in the parenthesis indicates the standard deviation: 40.8(7) indicates 40.8±0.7. In conclusion, we can see that combining the RIR method and the Rietveld method is effective as a quantitative analysis method without using internal standards.
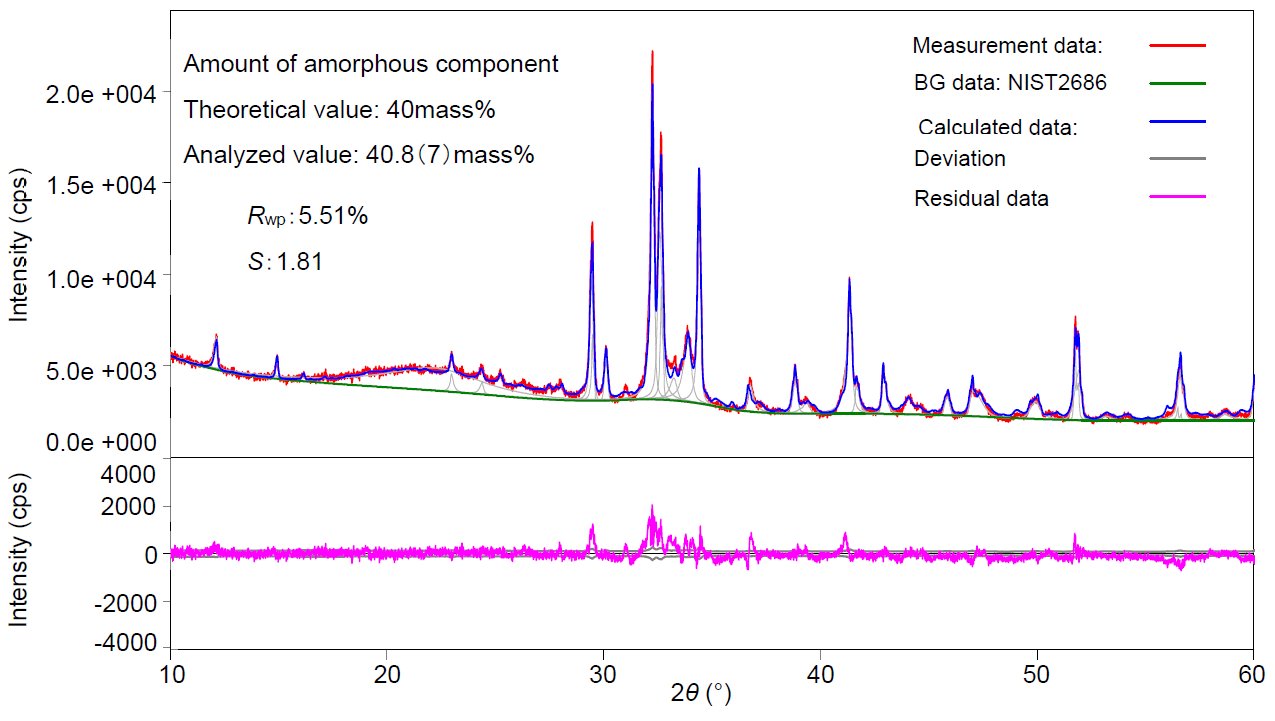 Figure 1: Quantitative analysis result of X-ray diffraction pattern and amorphous component when amorphous SiO₂ is added to cement standard sample

Core CTA - Contact us or speak to a specialist
Lorem ipsum dolor sit amet, consectetur adipiscing elit, sed do eiusmod tempor incididunt ut labore et dolore magna aliqua. Lorem ipsum dolor sit amet, consectetur adipiscing elit, sed do eiusmod tempor incididunt ut labore et dolore magna aliqua.